Money
Money
A comprehensive, evergreen guide to understanding why short-term bond yields eclipsing long-term yields signals economic anxiety across global markets.
Key points
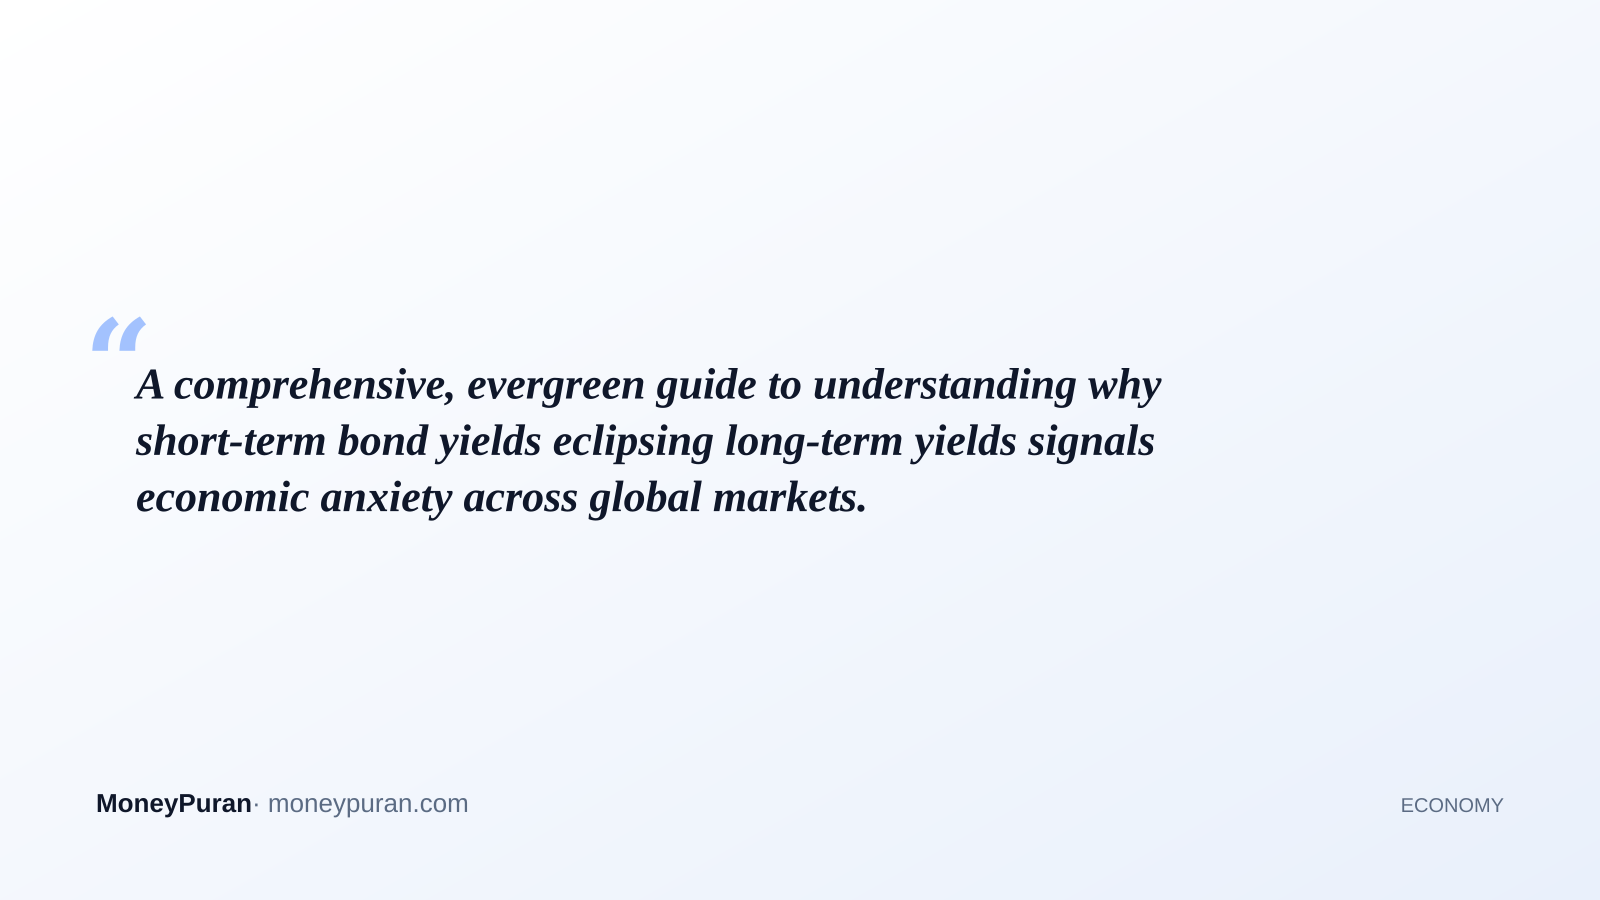
- A yield curve inversion happens when short-term government bond yields exceed long-term yields.
- Historically, this phenomenon has preceded every U.S. recession since 1955, typically taking 6 to 24 months to materialize.
- In standard economic conditions, investors demand higher interest for tying up money over longer periods.
- Market differences mean yield anomalies behave differently in emerging economies like India compared to the United States.
At its core, the yield curve inversion meaning boils down to a profound shift in how bond markets view the economic future. Normally, investors expect to earn a higher return for lending money over a longer period, such as 10 years, compared to just a few months or two years. When that relationship flips—and short-term debt pays a higher interest rate than long-term debt—the yield curve inverts. This rare anomaly is widely tracked by economists and investors as a flashing warning light for the broader economy.
How the Yield Spread Works
To understand the mechanics, you have to look at how government borrowing rates function. When you examine the US Treasury yield curve, a normal, healthy market slopes upward. Short-term yields are low because the immediate risk is low, while long-term yields are higher to compensate for inflation and duration risks over decades.
During an inversion, the spread between the 10-year Treasury note and the 2-year Treasury note (or the 3-month bill) falls below zero. Formulaically, when the 10-year yield minus the short-term yield is negative, the curve has inverted. This happens because central banks raise short-term interest rates to fight inflation, while investors rush into long-term bonds anticipating a future economic slowdown, driving long-term yields down.
Why Investors Watch This Signal Closely
Markets pay attention because history shows a remarkable correlation between inversions and economic downturns. In the United States, an inverted curve has preceded every single recession since 1955. However, patience is required: the lag time between the curve inverting and a recession actually beginning typically ranges from 6 to 24 months.
The inversion itself does not cause a recession; rather, it reflects the collective expectation of institutional investors that the central bank will eventually be forced to slash interest rates in response to a stalling economy.
Comparing US Markets and India’s Debt Landscape
While the mathematical definition remains consistent, the predictive power of yield anomalies varies significantly across geographic borders due to structural differences in financial systems.
- United States: Widely standardized around U.S. Treasury spreads (10-year vs. 2-year or 3-month), serving as a primary macroeconomic indicator monitored by the Federal Reserve and Wall Street.
- India: Applies to government securities (G-secs). However, complete inversions are rarer and less standardized as recession predictors because India’s banking sector is heavily regulated, and institutional participation differs vastly from Western markets.
Frequently Asked questions
Does an inverted yield curve mean a recession is guaranteed? While it has a strong historical track record in the U.S., economic indicators are never 100% foolproof. Some cycles experience soft landings where growth slows without contracting into a full recession.
How long does an inversion usually last? An inversion can persist anywhere from a few weeks to more than a year before the curve eventually steepens back to its normal upward slope.
Should I sell all my stocks when the yield curve inverts? Market timing is notoriously difficult. An inversion warns of future risk, but equity markets can continue to rise for many months after the initial flip occurs.
This article is for general education and is not investment, tax or financial advice. Rules and figures change — check the official source or a licensed adviser before acting.
Official information: https://www.federalreserve.gov
This explainer is published by the MoneyPuran desk for general awareness. Rules, limits and rates change over time — please confirm with the official source. Corrections: corrections@moneypuran.com