 Money

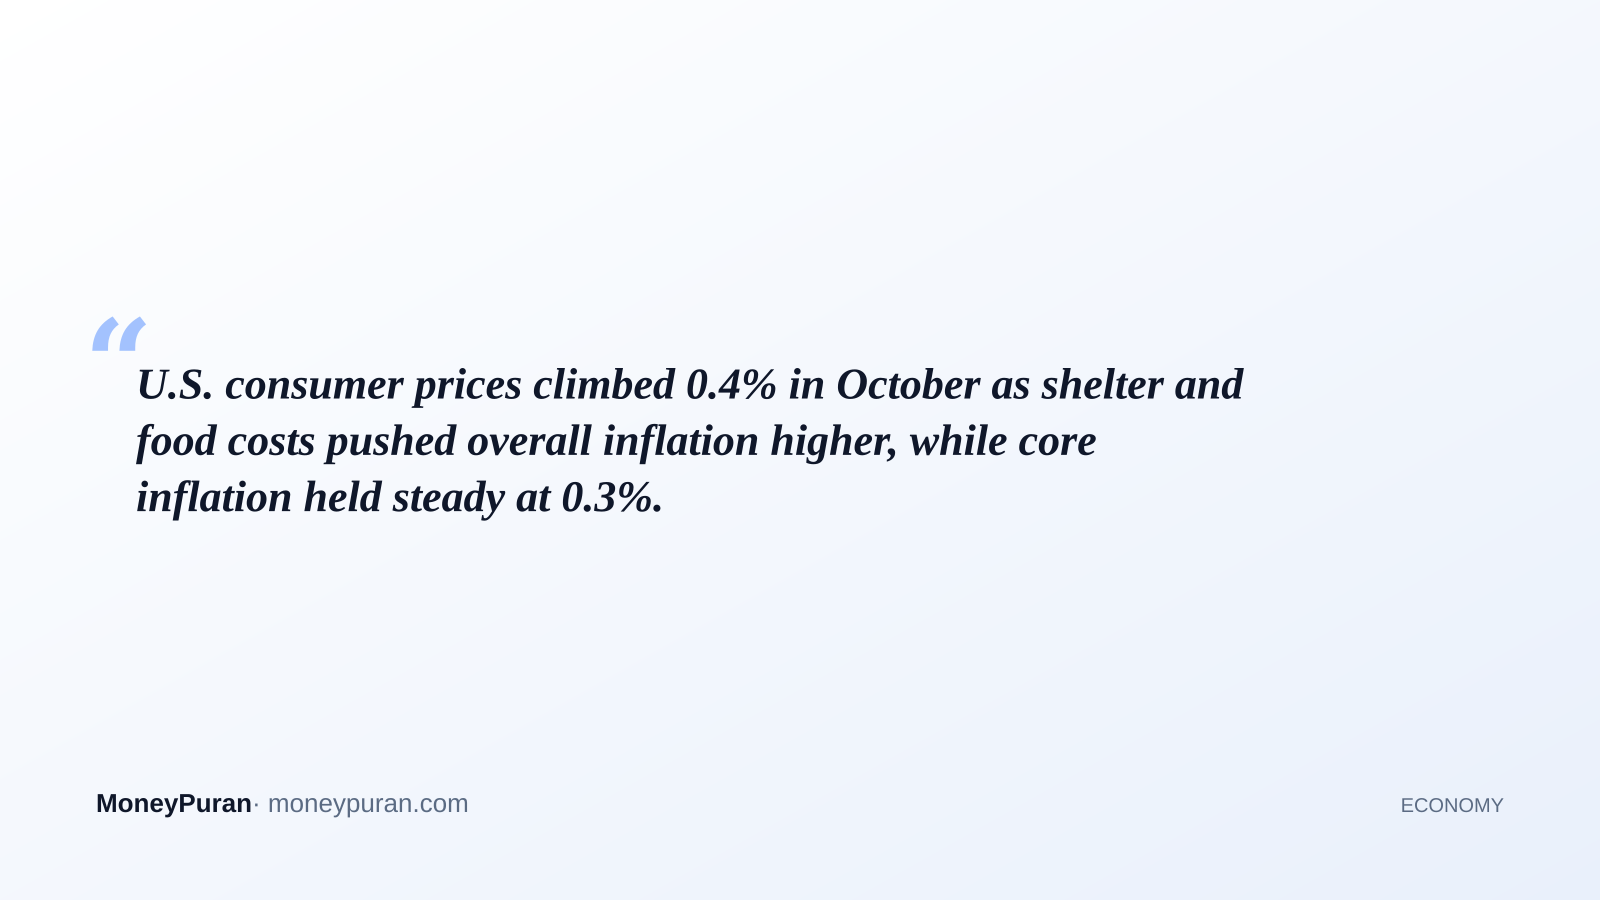
U.S. consumer prices climbed 0.4% in October as shelter and food costs pushed overall inflation higher, while core inflation held steady at 0.3%.
Key points
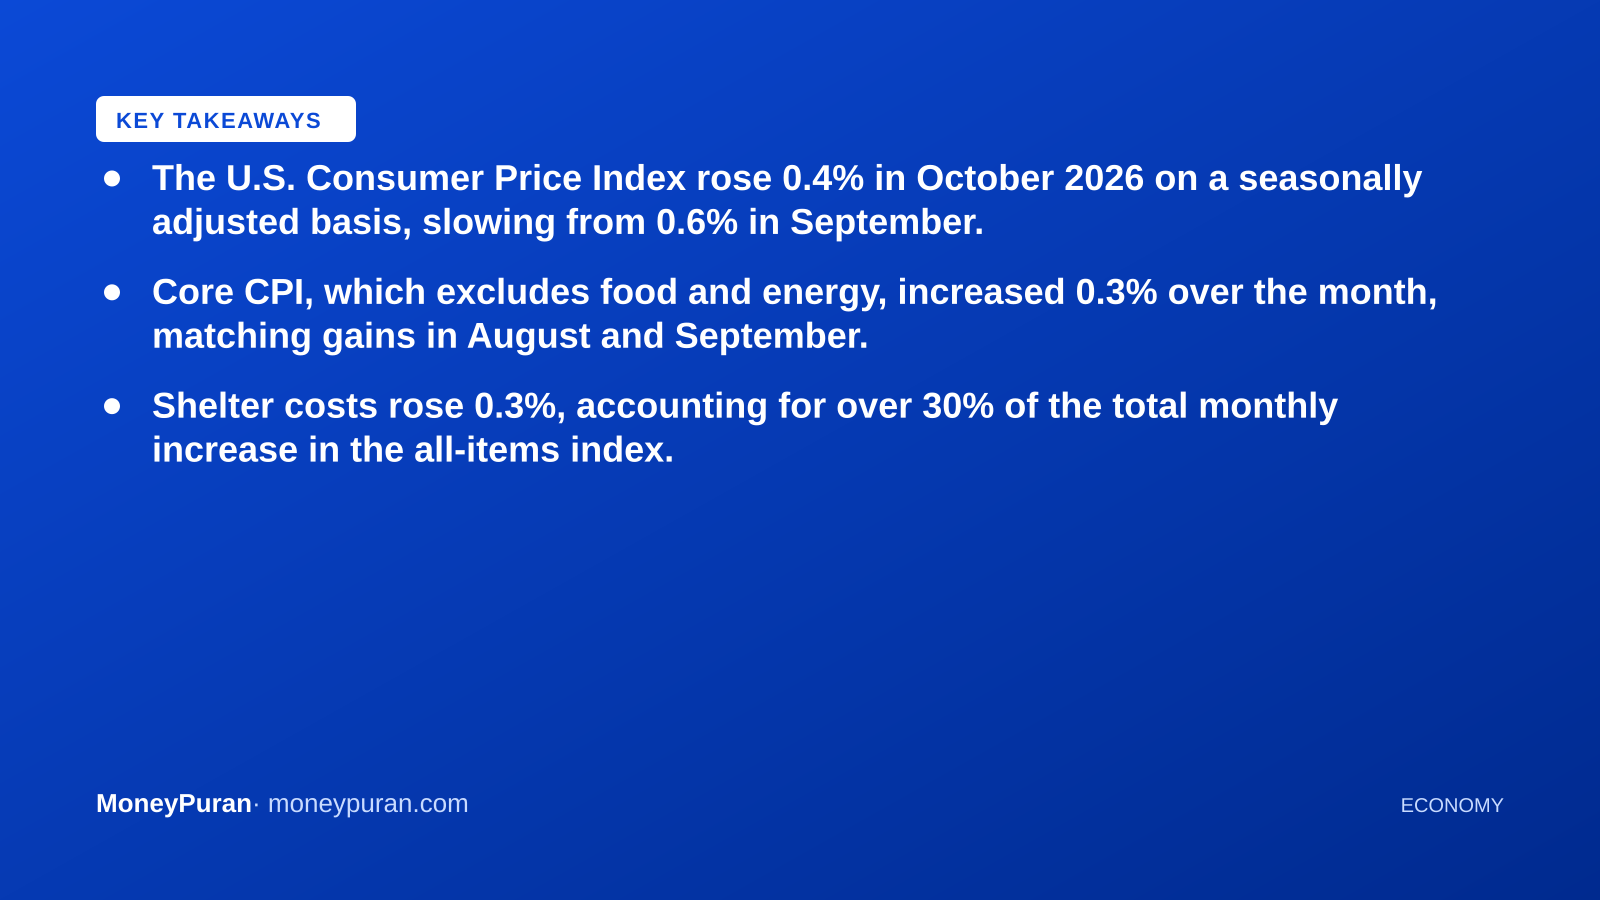
- The U.S. Consumer Price Index rose 0.4% in October 2026 on a seasonally adjusted basis, slowing from 0.6% in September.
- Core CPI, which excludes food and energy, increased 0.3% over the month, matching gains in August and September.
- Shelter costs rose 0.3%, accounting for over 30% of the total monthly increase in the all-items index.
- Food prices rebounded 0.5% following a flat reading in September, driven by higher grocery and restaurant costs.
- The BLS noted that 12-month percentage changes could not be published for many series due to missing October 2025 survey data from a lapse in federal appropriations.
U.S. consumer prices rose in October 2026 as sustained pressure from housing and grocery costs kept headline US CPI inflation advancing, according to official data released by the U.S. Bureau of Labor Statistics. The Consumer Price Index for All Urban Consumers increased 0.4 percent on a seasonally adjusted basis over the month, following a 0.6 percent gain recorded in September. The moderate step-down in the headline pace reflects a sharp cooling in energy price growth, even as underlying price pressure across service categories remained persistent.
Breakdown of primary consumer inflation drivers
The acceleration in monthly living costs was led primarily by shelter and food expenditures. The index for shelter increased 0.3 percent in October, accounting for more than 30 percent of the total monthly rise across all items. Within the shelter category, owners’ equivalent rent increased 0.3 percent, while rent of primary residence rose 0.2 percent. Lodging away from home rose 0.6 percent over the month, cooling from a 2.0 percent jump in September.
Food costs accelerated significantly during the month, with the overall food index rising 0.5 percent after staying flat in September. Grocery prices, represented by the food at home index, increased 0.4 percent. Meat, poultry, fish, and eggs rose 0.5 percent, boosted by a 0.9 percent increase in beef prices. Fruits and vegetables alongside dairy products both climbed 0.6 percent, while snack prices jumped 1.0 percent. Dining out also grew more expensive, as the food away from home index advanced 0.5 percent.
Energy inflation moderated significantly compared to previous periods. The energy index rose 0.7 percent in October, a marked slowdown from the 5.2 percent surge registered in September. Gasoline prices grew 1.0 percent over the month after jumping 9.1 percent in September, while electricity prices rose 0.9 percent. Natural gas offered a partial offset, falling 0.8 percent.
Core CPI trends and itemized price changes
Excluding volatile food and energy components, core US CPI inflation rose 0.3 percent in October. This matched the 0.3 percent gains reported in both August and September, indicating steady baseline price momentum across the broader economy. Unadjusted, the overall CPI-U reached an index level of 337.511.
- Headline CPI: Increased 0.4 percent month-on-month (seasonally adjusted).
- Core CPI: Advanced 0.3 percent month-on-month (seasonally adjusted).
- Shelter Index: Rose 0.3 percent, contributing over a third of headline gains.
- Food Index: Increased 0.5 percent month-on-month.
- Energy Index: Rose 0.7 percent, down from 5.2 percent in September.
- Used Cars and Trucks: Declined 1.2 percent, offsetting gains elsewhere.
Beyond housing, gains were observed across several major core components. Recreation costs expanded 0.8 percent, medical care services increased 0.3 percent—supported by a 0.8 percent rise in hospital services—and motor vehicle insurance gained 0.7 percent. New vehicles, apparel, and personal care also ticked higher. In contrast, used cars and trucks dropped 1.2 percent, and communication services declined 0.1 percent.
Data gaps affect 12-month annual inflation comparison
The official report highlighted an unusual statistical caveat regarding annual figures. Due to a previous lapse in federal government appropriations during October 2025, the BLS was unable to collect field survey data for that month. Consequently, standard 12-month percentage change comparisons for October 2026 could not be calculated or published for series lacking the 2025 base data.
What this means for investors
For financial market participants, the steady 0.3 percent monthly pace in core inflation indicates that price pressures in the U.S. service sector remain durable. Because central bankers pay close attention to monthly core trends when assessing monetary policy, an persistent 0.3 percent monthly increase keeps market expectations anchored toward cautious policy positioning. High interest rate expectations in the United States typically bolster U.S. Treasury yields and maintain strength in the U.S. dollar index.
For Indian stock markets and domestic investors, persistent U.S. inflation readings carry direct read-throughs for foreign institutional investor (FII) capital flows and foreign exchange dynamics. When U.S. yields stay elevated, foreign portfolio investors often reduce risk exposure in emerging markets like India, potentially weighing on heavyweight indices such as the Nifty 50 and Sensex. Additionally, a firm U.S. dollar places gradual pressure on the Indian rupee, which can elevate import costs for major domestic sectors reliant on imported commodities and crude oil.
Investors should continue tracking subsequent U.S. labor market releases and upcoming inflation statistics to gauge how global central banks will calibrate benchmark interest rates heading into the final quarter of the year.
Frequently asked questions
What was the monthly US CPI inflation rate for October 2026? The Consumer Price Index rose 0.4 percent on a seasonally adjusted basis in October 2026, compared to a 0.6 percent increase in September.
Why were 12-month CPI inflation numbers omitted for October 2026? The Bureau of Labor Statistics could not collect survey data in October 2025 due to a lapse in federal funding. Without accurate baseline index numbers for October 2025, official 12-month percentage changes could not be generated for affected categories.
Which categories contributed the most to October inflation? Shelter costs and food prices were the primary drivers, with shelter alone accounting for over 30 percent of the overall monthly increase in consumer prices.
This article is for information only and is not investment advice. Do your own research or consult a licensed adviser before investing.
Based on information published by U.S. Bureau of Labor Statistics (BLS). Source: U.S. Bureau of Labor Statistics (BLS). Spotted an error? corrections@moneypuran.com