Money
Money

Major Wall Street indices closed in opposite directions on September 7, 2026, as traders digested the latest session data.
Key points
- S&P 500 closed at 7,718.60, up 0.09% for the session.
- Dow Jones Industrial Average fell 0.27% to finish at 53,414.25.
- Nasdaq Composite advanced 0.40% to reach 26,506.99.
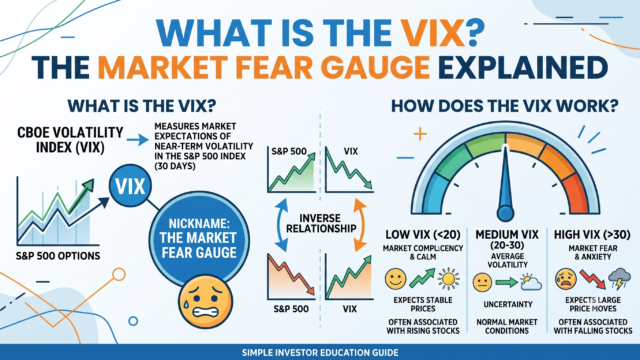
- CBOE Volatility Index (VIX) dropped 6.36% down to 15.30.
- US 10-Year Treasury Yield ticked up to 4.78%.
The US stock market delivered a mixed performance across major benchmark indices during the trading session on September 7, 2026. Investors and market participants parsed the latest closing figures while tracking movements in Treasury yields and market volatility measures. While technology-heavy shares found marginal support, blue-chip industrial equities faced downward pressure as the broader financial landscape adjusted to ongoing economic conditions.
Understanding US stock market movements
Market watchers frequently monitor the primary Wall Street gauges to gauge overall investor sentiment and capital allocation trends. In recent years, index performance has remained sensitive to shifts in benchmark interest rates, corporate earnings announcements, and macroeconomic indicators released by federal agencies. Understanding how individual indices such as the S&P 500 and the Nasdaq Composite interact helps long-term portfolio managers evaluate sector rotation and risk exposure across different asset classes.
During Monday’s session, market breadth demonstrated divergence among major asset groups. The S&P 500 managed a modest gain, settling up by a fraction of a percentage point, whereas the Dow Jones Industrial Average experienced a mild pullback. Meanwhile, growth-oriented equities listed on the Nasdaq Composite outperformed their large-cap peers, posting the most notable advance of the primary indices.
Key index levels and metrics
Official market data for the trading session highlighted specific closing levels and daily fluctuations across various benchmarks:
- S&P 500 closed at 7,718.60, representing a 0.09% increase from its previous close.
- Dow Jones Industrial Average dropped 0.27% to settle at 53,414.25.
- Nasdaq Composite gained 0.40%, finishing the day at 26,506.99.
- Russell 2000 rose 0.11% to reach 2,975.65.
- CBOE Volatility Index (VIX) fell 6.36% to close at 15.30.
- US 10-Year Treasury Yield ticked up 0.55% to stand at 4.78%.
The contraction in the CBOE Volatility Index suggests that market participants experienced a relatively calm environment regarding near-term portfolio risk. A lower VIX reading typically correlates with reduced expected price fluctuations in the options market, though traders continuously evaluate macroeconomic catalysts that could alter market dynamics rapidly.
Broader economic implications
Movements in the US stock market are closely tied to fixed-income markets, particularly US Treasury securities. The benchmark 10-Year Treasury Yield edged higher during the session, reaching 4.78%. Bond yields serve as a critical pricing mechanism for mortgages, corporate debt, and consumer loans, influencing corporate borrowing costs and equity valuations alike.
As financial markets navigate the remainder of 2026, participants will continue to monitor incoming data releases regarding inflation, employment, and central bank policy announcements. Market commentators emphasize that diversification and disciplined risk management remain fundamental principles for navigating periods of fluctuating equity prices and changing interest rate environments.
Frequently asked questions
What caused the mixed performance in the US stock market today? The session closed with mixed results as individual sectors experienced varying buying and selling pressures, reflected in the contrasting movements of the Dow Jones and the Nasdaq.
Where can investors find official market data? Official closing prices and historical records are published by major exchanges, financial data providers, and regulatory reporting services at the conclusion of each trading day.
This article is for information only and is not investment advice. Do your own research or consult a licensed adviser before investing.
Based on information published by MoneyPuran market data. Source: MoneyPuran market data. Spotted an error? corrections@moneypuran.com