Money
Money

The Nasdaq Composite and S&P 500 advanced while the Dow dropped, as volatility dipped and 10-year Treasury yields moved higher.
Key points
- S&P 500 closed up 0.09% at 7,718.60 on September 4, 2026.
- Nasdaq Composite rose 0.40% to 26,506.99, leading major benchmarks higher.
- Dow Jones Industrial Average dropped 0.27% to finish at 53,414.25.
- 10-Year US Treasury yield climbed to 4.78%, while the VIX volatility index declined 2.61%.
In the US stock market today, major equity benchmarks delivered a mixed performance on September 4, 2026, as gains in technology-heavy indices offset modest declines among blue-chip industrial stocks. The broad-based S&P 500 managed a slight gain, while the Nasdaq Composite outperformed and the Dow Jones Industrial Average ended the session in negative territory. Meanwhile, small-cap stocks registered small gains, market volatility diminished, and benchmark Treasury yields edged higher.
Major index moves in the US stock market today
Trading across major benchmarks displayed divergence throughout the session. The S&P 500 added 6.84 points, or 0.09 percent, to close at 7,718.60. During intraday action, the benchmark index traversed between a low of 7,706.12 and a high of 7,750.19, after settling at 7,711.76 in the prior session.
The tech-heavy Nasdaq Composite led the upside among major averages. The index gained 104.57 points, or 0.40 percent, finishing at 26,506.99. The Nasdaq moved within a range of 26,444.84 to 26,628.58 after having closed at 26,402.42 on the previous trading day.
In contrast, the Dow Jones Industrial Average experienced selling pressure. The 30-stock blue-chip average fell by 145.74 points, representing a decline of 0.27 percent, to close at 53,414.25. The Dow recorded a daily low of 53,289.88 and reached a high of 53,635.35, following its previous close of 53,559.99.
Small-cap equities mirrored the broader market’s cautious optimism. The Russell 2000 index edged up by 3.28 points, or 0.11 percent, to end at 2,975.65. Intraday trading saw the small-cap index move between 2,951.04 and 2,976.66, compared to its previous close of 2,972.37.
Volatility and bond yields in the US stock market today
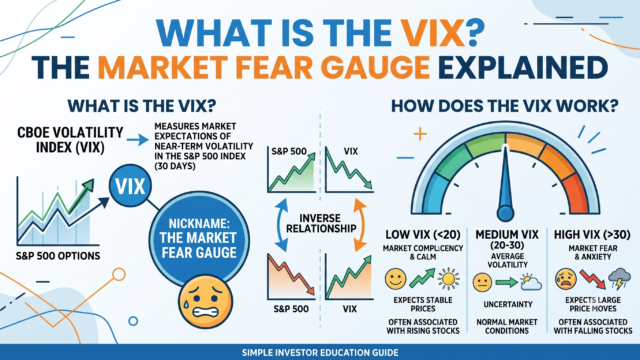
Across the US stock market today, measures of market anxiety eased even as fixed-income yields moved upward. The CBOE Volatility Index, often referred to as Wall Street’s fear gauge, dropped by 0.39 points, or 2.61 percent, to close at 14.53. The volatility index fluctuated between a low of 13.80 and a high of 14.58 over the course of the session, falling from its previous mark of 14.92.
In the fixed-income market, the yield on the 10-year US Treasury note rose by 0.55 percent to stand at 4.78 percent at the close. The benchmark yield traded within an intraday range of 4.75 percent to 4.81 percent, after closing at 4.76 percent in the preceding session.
Summary of key benchmark closing numbers
The following figures reflect the official closing statistics for September 4, 2026:
- S&P 500: 7,718.60 (+0.09%, range: 7,706.12 – 7,750.19, previous close: 7,711.76)
- Dow Jones Industrial Average: 53,414.25 (-0.27%, range: 53,289.88 – 53,635.35, previous close: 53,559.99)
- Nasdaq Composite: 26,506.99 (+0.40%, range: 26,444.84 – 26,628.58, previous close: 26,402.42)
- Russell 2000: 2,975.65 (+0.11%, range: 2,951.04 – 2,976.66, previous close: 2,972.37)
- CBOE Volatility Index (VIX): 14.53 (-2.61%, range: 13.80 – 14.58, previous close: 14.92)
- 10-Year US Treasury Yield: 4.78% (+0.55%, range: 4.75% – 4.81%, previous close: 4.76%)
Understanding key market mechanics and indicators
Tracking the US stock market today provides essential context for investors seeking to understand broad economic conditions and asset valuation trends. Stock market indices serve as barometers for underlying corporate health, investor sentiment, and capital allocation across various sectors of the economy.
When major stock indices display divergent trends—such as technology shares advancing while industrial equities soften—it often points to sector rotation. Sector rotation occurs when market participants reallocate capital from one industry group to another based on changing economic expectations, corporate earnings outlooks, or shifts in interest rate environments. Broad market benchmarks like the S&P 500 reflect weighted performance across hundreds of large-cap companies, providing a balanced snapshot of market health.
Yields on US Treasury securities play a critical role in global finance by establishing the risk-free rate of return. Higher Treasury yields increase borrowing costs for corporations and consumers alike, while also altering discount rates used by analysts to value future corporate earnings. Meanwhile, volatility indicators like the VIX measure implied market volatility derived from option prices, offering insight into perceived equity market risks over a short horizon.
Frequently asked questions
How did major indices perform in the US stock market today? On September 4, 2026, the S&P 500 rose 0.09%, the Nasdaq Composite gained 0.40%, and the Russell 2000 advanced 0.11%, while the Dow Jones Industrial Average dropped 0.27%.
What happened to bond yields and market volatility? The 10-year Treasury yield rose to 4.78%, while the CBOE Volatility Index (VIX) fell 2.61% to 14.53.
This article is for information only and is not investment advice. Do your own research or consult a licensed adviser before investing.
Based on information published by MoneyPuran market data. Source: MoneyPuran market data. Spotted an error? corrections@moneypuran.com