 Money


Provisional results from the Reserve Bank of India show unlisted entities dominate direct foreign inflows, while outward investment ratios moderated sharply.
Key points
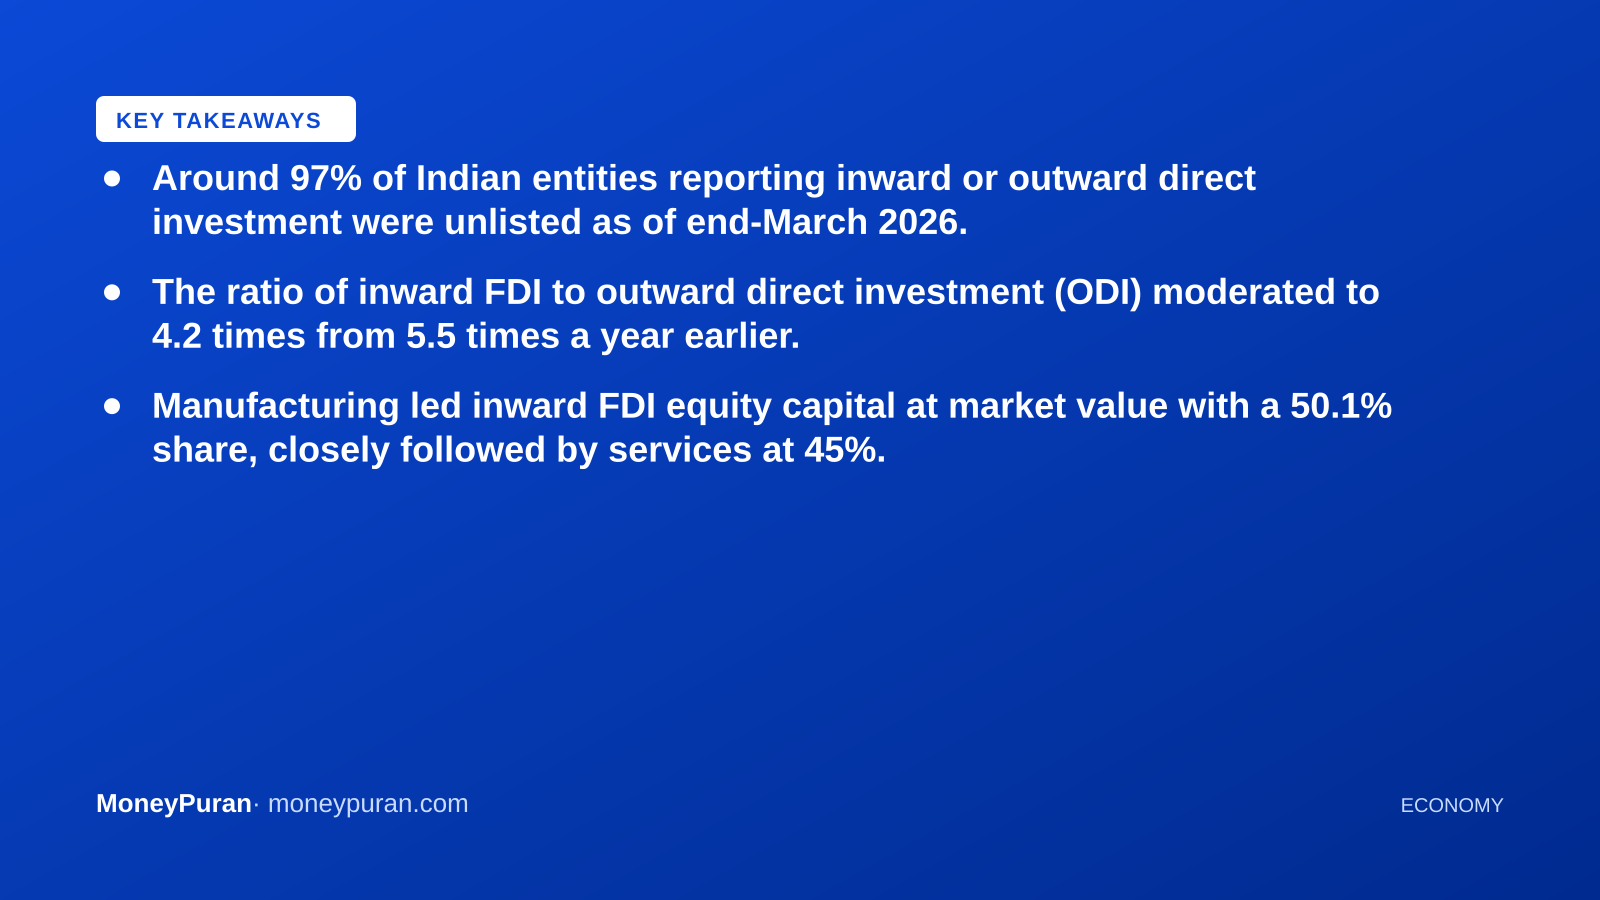
- Around 97% of Indian entities reporting inward or outward direct investment were unlisted as of end-March 2026.
- The ratio of inward FDI to outward direct investment (ODI) moderated to 4.2 times from 5.5 times a year earlier.
- Manufacturing led inward FDI equity capital at market value with a 50.1% share, closely followed by services at 45%.
- The US remained the top source of inward FDI at 16.5%, while Singapore led outbound Indian investments at 21.1%.
The Reserve Bank of India has released provisional findings from its 2025-26 round of the annual Census on Foreign Liabilities and Assets covering cross-border holdings of Indian entities. According to the central bank report, unlisted companies continue to dominate the foreign direct investment landscape, accounting for 97 per cent of reporting entities and holding nearly the entirety of face-value FDI equity capital in India.
The annual survey captures detailed balance sheet metrics across direct investments, portfolio allocations, trade credits, loans, and other cross-border assets and liabilities held by companies, limited liability partnerships, alternative investment funds, and partnership firms.
Unlisted Entities Lead Equity and Debt Holdings
Data from the Reserve Bank of India shows that a total of 43,123 entities reported inward or outward direct investment as of end-March 2026. Of the 36,168 entities reporting inward direct investment, approximately 75 per cent were subsidiaries of foreign entities, defined as companies where a single foreign investor holds more than 50 per cent of total equity.
Unlisted Indian firms accounted for ₹10,85,061 crore, or 97.9 per cent, of total FDI equity capital measured at face value. However, when measured at market value, equity distribution between listed and unlisted entities was closely balanced. Listed entities held ₹33,25,744 crore in market-value foreign equity, while unlisted entities held ₹35,19,233 crore out of a total ₹68,44,977 crore. Unlisted entities held 96.6 per cent of all inward foreign debt liabilities, totaling ₹2,19,262 crore.
Manufacturing and Services Drive Foreign Inflows
Sectoral classification of inward direct investment highlights strong concentration in industrial production and corporate services. Non-financial companies held over 90 per cent of inward FDI equity at face value. At market valuation, the manufacturing sector represented 50.1 per cent of total FDI equity capital, standing at ₹34,27,882 crore. The broader services sector accounted for 44.8 per cent, or ₹31,10,757 crore.
Within manufacturing, electrical equipment, machinery, motor vehicles, chemical products, and basic metals commanded significant foreign participation. In the services domain, financial activities, insurance, and information technology infrastructure accounted for the primary share of foreign capital.
Outward Direct Investment and Top Source Countries
Indian corporate expansion overseas narrowed the gap between cross-border inflows and outflows during the period. The ratio of inward FDI to outward direct investment moderated to 4.2 times in rupee terms as of end-March 2026, down from 5.5 times recorded in the prior year. Total outward direct investment reached ₹16,71,463 crore at market value, up from ₹11,86,744 crore in March 2025.
The United States was the leading single source of outstanding inward FDI, accounting for 16.5 per cent of total holdings, followed by Mauritius at 14.5 per cent, Singapore at 13.7 per cent, and the United Kingdom at 10.8 per cent. For Indian outward investments, Singapore emerged as the top destination, receiving 21.1 per cent of outward direct investment, followed by the United Arab Emirates at 16.2 per cent and the United States at 13.9 per cent.
Key Census Figures at a Glance
- Total Reporting Entities: 43,123 Indian entities reported foreign direct investment or overseas direct investment as of end-March 2026.
- Inward FDI Total Value: ₹70,71,945 crore at market value, comprising ₹68,44,977 crore in equity and ₹2,26,968 crore in debt.
- Outward ODI Total Value: ₹16,71,463 crore at market value, comprising ₹13,30,455 crore in equity and ₹3,41,008 crore in debt.
- Top Inward Source: United States (₹11,68,000 crore total direct investment).
- Top Outward Destination: Singapore (₹3,52,822 crore total direct investment).
What this means for investors
The Reserve Bank of India’s foreign liabilities census offers clear visibility into how long-term structural capital flows into the Indian economy. For equity investors, the heavy reliance of inward FDI on the manufacturing and technology service sectors reinforces international corporate confidence in India’s industrial base and service infrastructure. The near-equal split in market value between listed and unlisted inward FDI demonstrates that foreign institutional strategy balances private growth capital with public equity holdings.
Furthermore, the narrowing ratio of inward FDI to outward direct investment highlights the global footprint of Indian multinationals. As domestic firms expand cross-border capital deployment into hubs like Singapore and the UAE, Indian corporate balance sheets become increasingly diversified across international revenue streams and global supply chains.
Frequently asked questions
What is the RBI FLA census? It is an annual survey conducted by the Reserve Bank of India that tracks cross-border financial liabilities and assets of Indian entities holding direct investments.
Why do unlisted companies dominate FDI face value? Foreign multinational corporations often set up wholly owned unlisted subsidiaries or private limited entities in India for direct operating control, concentrating face-value equity outside the public stock exchanges.
This article is for information only and is not investment advice. Do your own research or consult a licensed adviser before investing.
Based on information published by Reserve Bank of India (RBI). Source: Reserve Bank of India (RBI). Spotted an error? corrections@moneypuran.com