Money
Money

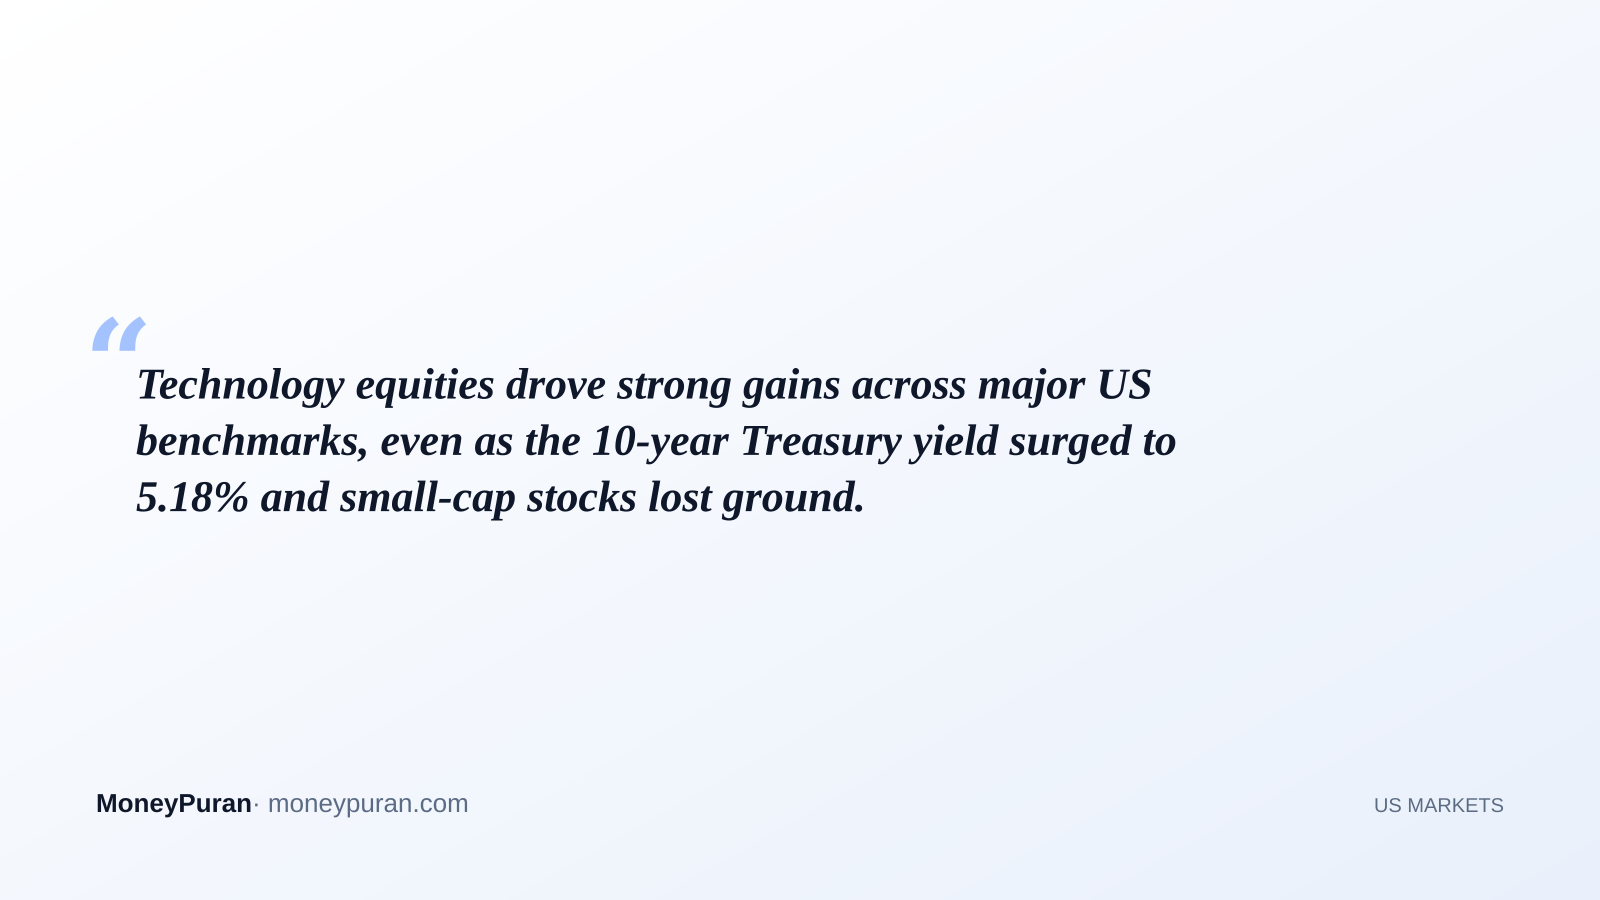
Technology equities drove strong gains across major US benchmarks, even as the 10-year Treasury yield surged to 5.18% and small-cap stocks lost ground.
Key points
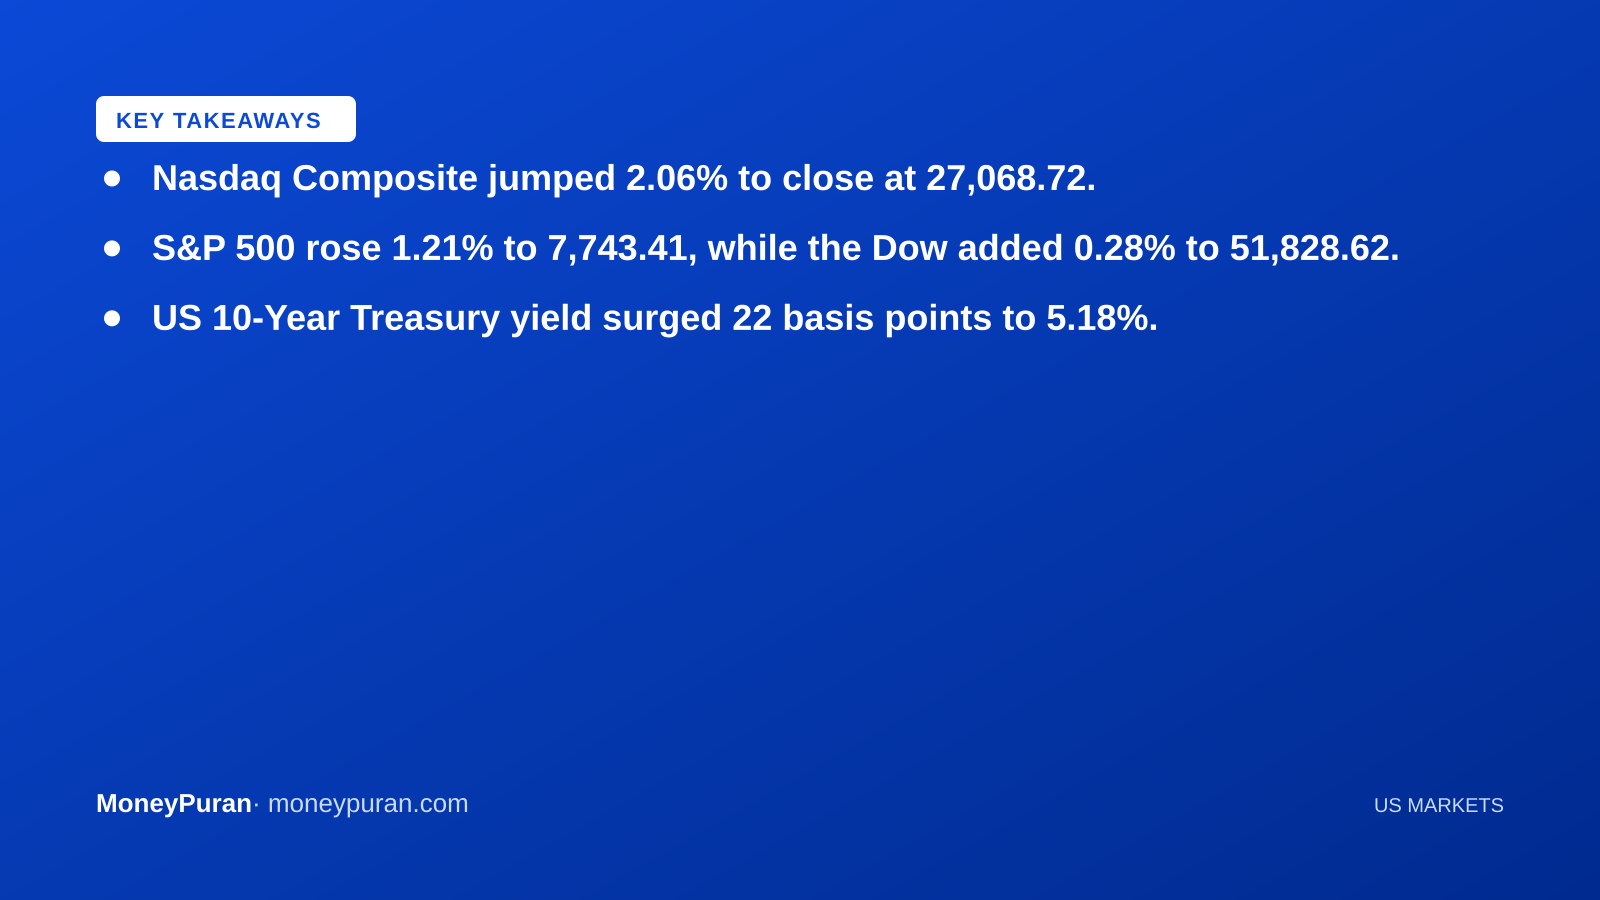
- Nasdaq Composite jumped 2.06% to close at 27,068.72.
- S&P 500 rose 1.21% to 7,743.41, while the Dow added 0.28% to 51,828.62.
- US 10-Year Treasury yield surged 22 basis points to 5.18%.
- Russell 2000 small-cap index slipped 0.80% to 2,837.55.
- CBOE Volatility Index (VIX) remained flat at 14.87.
The US stock market delivered a strong tech-led performance on September 25, 2026, with major benchmark indices advancing even as fixed-income yields experienced a sharp upward move. Technology shares powered the Nasdaq Composite higher by more than 2%, while the broader S&P 500 also posted solid gains. However, the market session reflected significant divergence across sectors and asset classes, as small-cap equities closed in negative territory and government bond yields surged past key psychological thresholds.
Nasdaq Leads Wall Street Higher as Tech Outperforms
Technology momentum dominated trading during the session, pushing major equity benchmarks into positive territory despite headwinds from rising borrowing costs. The Nasdaq Composite gained 546.18 points, or 2.06%, to finish at 27,068.72, trading near its daily high of 27,122.76 after opening from a previous close of 26,522.54.
The broader market was similarly lifted by large-cap strength. The S&P 500 advanced 92.91 points, or 1.21%, to settle at 7,743.41, spanning an intraday range between 7,693.08 and 7,752.07. Meanwhile, the blue-chip Dow Jones Industrial Average lagged the broader rally but finished higher, adding 145.98 points, or 0.28%, to end at 51,828.62 after rebounding from an intraday low of 51,339.24.
Treasury Yields Spike as Small Caps Diverge
Despite the optimism in large-cap growth sectors, fixed-income markets saw significant selling pressure, pushing bond yields higher across the curve. The benchmark US 10-Year Treasury Yield rose by 22 basis points to 5.18%, registering a 4.45% daily increase from its previous close of 4.96%. During the session, the 10-year yield fluctuated between 5.16% and 5.23%.
Higher interest rates appeared to weigh heavily on smaller companies, which tend to carry higher refinancing risks and debt burdens. The small-cap Russell 2000 index bucked the broader upward market trend, dropping 22.85 points, or 0.80%, to close at 2,837.55 after reaching a low of 2,826.79. Meanwhile, equity market volatility remained subdued, with the CBOE Volatility Index (VIX) ending unchanged at 14.87.
Key Closing Numbers at a Glance
- S&P 500: 7,743.41 (+1.21% / +92.91 pts)
- Nasdaq Composite: 27,068.72 (+2.06% / +546.18 pts)
- Dow Jones Industrial Average: 51,828.62 (+0.28% / +145.98 pts)
- Russell 2000: 2,837.55 (-0.80% / -22.85 pts)
- US 10-Year Treasury Yield: 5.18% (+22 bps / +4.45%)
- CBOE Volatility Index (VIX): 14.87 (unchanged)
Impact on Indian Markets and Emerging Assets
The session’s movements in US markets carry key implications for Indian stock exchanges and emerging market capital flows. The sharp rise in the US 10-year Treasury yield to 5.18% widens the yield differential between US debt and Indian sovereign bonds. A higher risk-free rate in the US often reduces the incentive for foreign institutional investors (FIIs) to allocate capital to riskier emerging market equities, which could lead to tighter liquidity and foreign capital outflows on Dalal Street.
On the sector front, the robust rally in US technology stocks frequently acts as a positive sentiment indicator for Indian Information Technology exporters listed on the NSE and BSE. Indian IT companies often track overnight developments in the Nasdaq Composite closely, though persistent yield pressure and currency moves could temper domestic gains. Investors on the Indian exchanges will also be watching foreign exchange rates, as high US yields typically exert upward pressure on the US dollar against the Indian rupee.
What this means for investors
The clear divergence between mega-cap technology stocks and small-cap equities highlights an environment where large, well-capitalized companies are demonstrating resilience despite higher borrowing costs. When long-term Treasury yields rise rapidly toward 5.2%, debt-heavy sectors and smaller firms often experience valuation adjustments, as reflected in the Russell 2000 decline.
For diversified equity investors, a rising yield environment signals that borrowing costs for corporations will likely remain elevated for longer. While large technology firms with robust cash reserves can navigate higher discount rates, broader market upside may become increasingly concentrated in quality, cash-generative businesses. Investors should monitor whether high yields begin to compress price-to-earnings multiples across non-tech sectors in upcoming sessions.
Additionally, asset allocation strategies should take into account the enhanced yield available in fixed-income instruments. With 10-year US Treasuries offering 5.18%, bond yields provide competitive competition to equity earnings yields, potentially altering capital allocation between risk assets and fixed-income portfolios over the coming quarters.
Frequently asked questions
Why did tech stocks rally while US bond yields increased? Tech mega-caps often benefit from strong balance sheets and market-leading earnings momentum, allowing them to attract investor interest even when higher interest rates elevate overall macroeconomic borrowing costs.
How does a surge in the 10-year US Treasury yield affect Indian stock markets? Higher US Treasury yields make dollar-denominated debt more attractive to global investors, which can lead to foreign portfolio capital outflows from Indian equities and put downward pressure on the Indian rupee.
What does a steady VIX reading indicate during a market move? A unchanged VIX level of 14.87 indicates that demand for portfolio hedging and index options remained steady, suggesting that market participants viewed the session’s equity advances and yield spikes without heightened systemic anxiety.
This article is for information only and is not investment advice. Do your own research or consult a licensed adviser before investing.
Based on information published by MoneyPuran market data. Source: MoneyPuran market data. Spotted an error? corrections@moneypuran.com