 Money

Heavy selling across technology shares dragged the Nasdaq down nearly 4%, while small caps bucked the trend and bond yields eased.

Key points
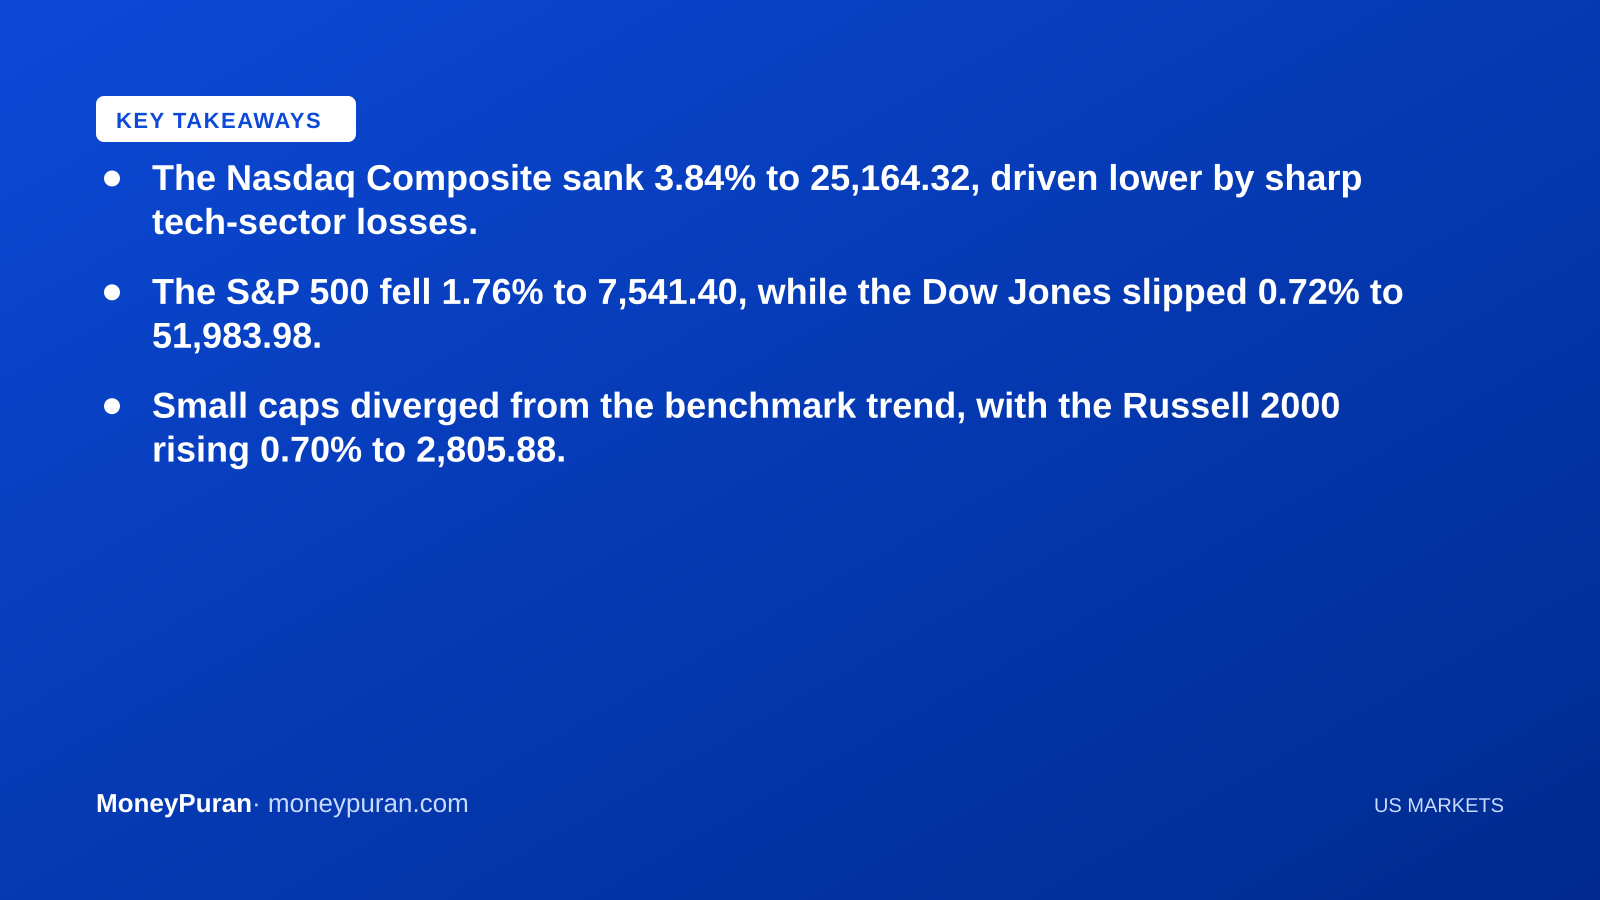
- The Nasdaq Composite sank 3.84% to 25,164.32, driven lower by sharp tech-sector losses.
- The S&P 500 fell 1.76% to 7,541.40, while the Dow Jones slipped 0.72% to 51,983.98.
- Small caps diverged from the benchmark trend, with the Russell 2000 rising 0.70% to 2,805.88.
- Volatility jumped as the CBOE VIX surged 20.72% to 21.15, while the 10-year yield fell to 4.89%.
The US stock market experienced sharp divergence on November 2, 2026, as a heavy sell-off in technology shares pulled down major benchmark indices while small-cap equities managed to hold positive territory. The tech-heavy Nasdaq Composite led the downturn, sliding nearly 3.8%, while the S&P 500 and the Dow Jones Industrial Average also closed lower amid a sharp surge in market volatility.
Tech slump drags benchmark indices lower
Wall Street benchmark indices spent most of the session under pressure as aggressive selling in large-cap growth and technology shares weighed heavily on performance. The Nasdaq Composite plummeted 1,005.06 points, or 3.84%, to close at 25,164.32, after trading between a high of 25,799.46 and a low of 25,145.95 during the day.
The broader S&P 500 index surrendered 135.37 points, falling 1.76% to settle at 7,541.40. It fluctuated within a daily range of 7,539.38 to 7,662.23. Meanwhile, the Dow Jones Industrial Average proved relatively more resilient, declining by 377.60 points, or 0.72%, to finish at 51,983.98 after moving between 51,981.66 and 52,424.91.
Divergent moves: Small caps rise as volatility surges
In contrast to the steep declines across mega-cap tech, small-cap shares attracted buying interest. The Russell 2000 index rose 19.46 points, or 0.70%, to finish at 2,805.88, recovering from a low of 2,805.11 after hitting an intraday high of 2,846.03. The resilience in smaller domestic companies highlighted a distinct split in market sentiment during the session.
Wall Street’s fear gauge flashed heightened anxiety among traders. The CBOE Volatility Index (VIX) surged by 20.72% to reach 21.15, rising from its previous close of 17.52 and touching a session high of 21.77. In fixed income markets, benchmark borrowing costs eased as the yield on the US 10-Year Treasury note fell by nearly two percent, dropping 10 basis points to 4.89% from 4.99%.
What this means for investors
For investors tracking global equity trends, the pronounced drop in US technology shares signals a sharp risk-off pivot within growth-heavy market segments. Indian investors holding exposure to US-focused mutual funds or international ETFs with heavy allocations toward tech giants will likely see short-term net asset value compressions. Additionally, weakness in US tech often creates temporary sentiment spillover into Indian IT services stocks traded on the NSE and BSE.
However, the concurrent decline in US Treasury yields to 4.89% and the gains in small-cap stocks suggest that money is shifting rather than exiting the financial system entirely. Lower US bond yields generally help cushion capital outflows from emerging markets like India over time, although a VIX reading above 21 warns that short-term market swings are likely to persist.
Market participants should closely observe whether US equity benchmarks stabilize around these levels or if institutional investors continue rebalancing portfolios away from high-valuation growth sectors toward value and defensive assets in upcoming trading sessions.
Key market metrics at a glance
- Nasdaq Composite: 25,164.32 (-3.84%)
- S&P 500 Index: 7,541.40 (-1.76%)
- Dow Jones Industrial Average: 51,983.98 (-0.72%)
- Russell 2000 Index: 2,805.88 (+0.70%)
- CBOE Volatility Index (VIX): 21.15 (+20.72%)
- US 10-Year Treasury Yield: 4.89% (-1.98%)
Frequently asked questions
Why did the Nasdaq drop much faster than the Dow Jones? Heavy concentration of large-cap technology and growth stocks in the Nasdaq Composite made it far more vulnerable to tech-sector selling, whereas the Dow Jones contains a broader mix of industrial and value-oriented companies.
What does a spike in the VIX above 21 mean for markets? A rise in the CBOE Volatility Index indicates increased demand for portfolio protection and higher expected price fluctuations in S&P 500 options over the next 30 days.
This article is for information only and is not investment advice. Do your own research or consult a licensed adviser before investing.
Based on information published by MoneyPuran market data. Source: MoneyPuran market data. Spotted an error? corrections@moneypuran.com