Money
Money
Unpack the dynamics behind the valuation gap between India’s top fifty giants and the high-growth waiting room tier.

Key points
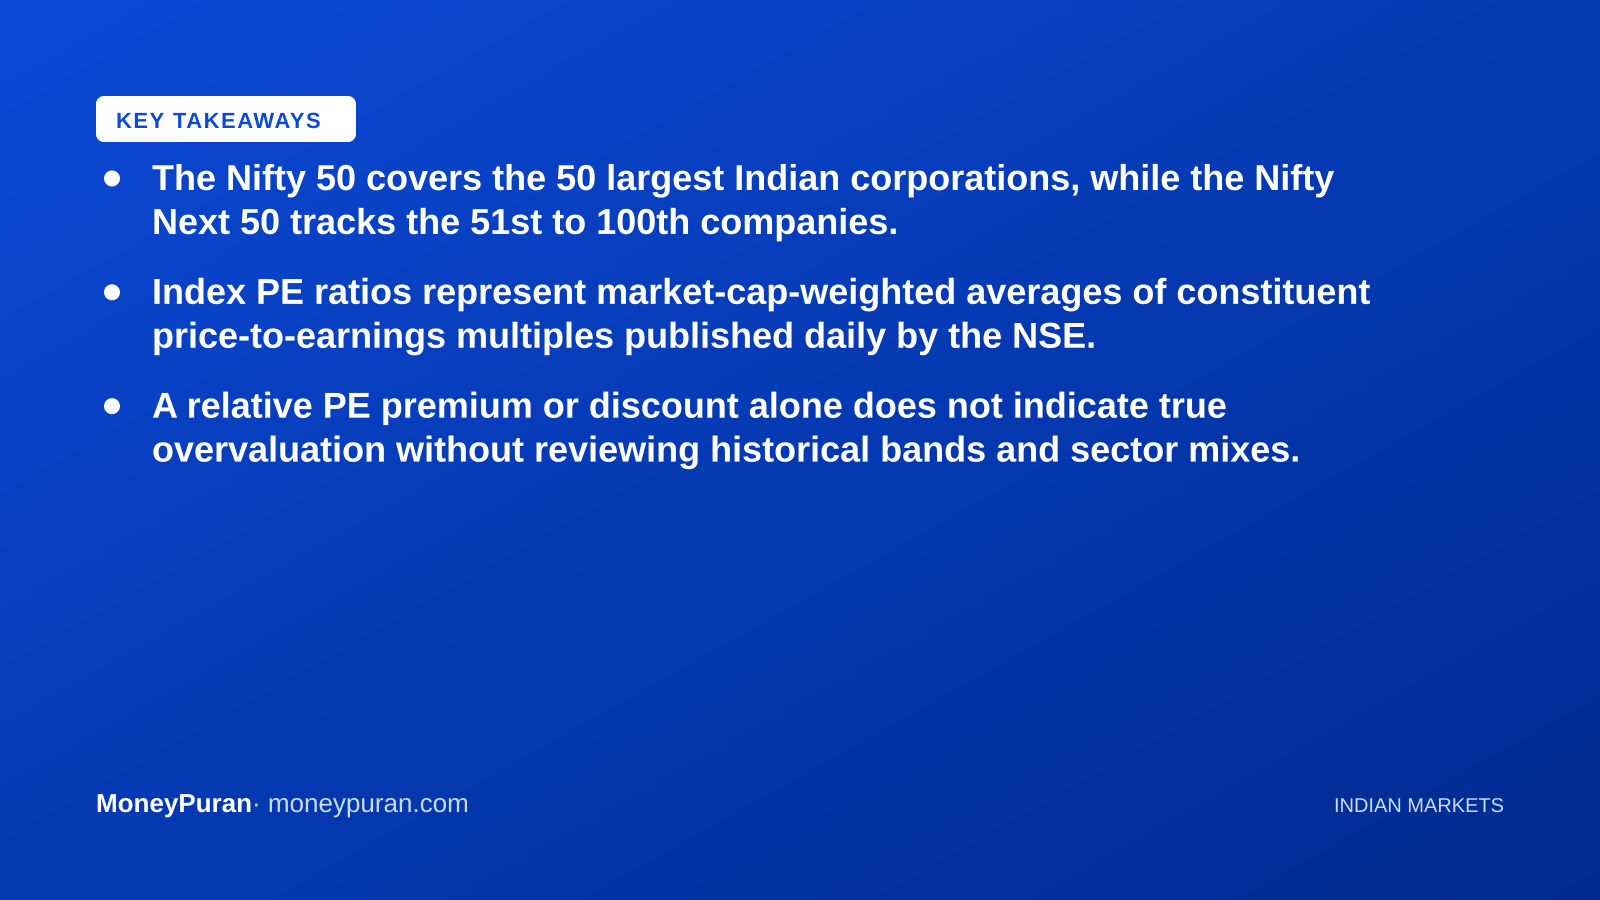
- The Nifty 50 covers the 50 largest Indian corporations, while the Nifty Next 50 tracks the 51st to 100th companies.
- Index PE ratios represent market-cap-weighted averages of constituent price-to-earnings multiples published daily by the NSE.
- A relative PE premium or discount alone does not indicate true overvaluation without reviewing historical bands and sector mixes.
- Cross-border comparisons reveal how similar large-cap and mid-cap index tiers behave across different global regulatory environments.
When examining Indian equity markets, comparing the nifty next 50 vs nifty 50 pe ratio gives investors a powerful window into market sentiment, risk appetite, and sector composition. The Nifty 50 comprises the fifty largest and most liquid corporations listed on the National Stock Exchange (NSE), featuring heavyweights in banking, information technology, and energy. Meanwhile, the Nifty Next 50 tracks the exact next tier—ranks 51 through 100 by market capitalization. Often described as the waiting room for future Nifty 50 entrants, this second index contains fewer legacy giants and a higher weight toward emerging mid-caps and cyclicals.
Understanding How Index Price-to-Earnings Multiples Work
The price-to-earnings (PE) ratio of an index is not a simple average of its constituent stocks. Instead, it is a market-capitalization-weighted average of the PE ratios of all companies within that index. This means a corporate giant with a massive valuation swings the index PE far more than a smaller constituent. These metrics are published daily by NSE Indices on each index’s official factsheet. When tracking indicators like why the market moved today, seasoned investors frequently check these daily sheets to see whether large-caps or emerging contenders are driving market momentum.
Decoding the Historical Valuation Gap
Historically, the valuation gap between these two indices fluctuates based on broader market cycles. During expansive, risk-on rallies, the Nifty Next 50 often trades at a PE premium to the Nifty 50. This happens because investors bid up future growth prospects and cyclical companies. Conversely, during risk-off corrections, the waiting-room index can de-rate faster than its mature counterpart because of its higher sensitivity to sentiment shifts. Relying on a single snapshot of the PE gap can be misleading; investors must evaluate whether either index is trading near its own historical 5-10 year median rather than just looking at the relative spread.
Key Differences in Sector Mix and Composition
A headline PE gap is rarely just about market exuberance—it almost always reflects underlying structural differences in sector allocation. The Nifty 50 features a high concentration of defensive, established financial services and IT exporters that tend to stabilize earnings across economic downturns. The Nifty Next 50 features broader exposure to consumer discretionary goods, specialized manufacturing, chemicals, and emerging industrials. Because these sectors experience sharper earnings growth phases during economic expansions, their earnings multiples naturally expand faster, creating a wider valuation spread.
Cross-Border Perspectives: US and India Markets
The structural dynamics of comparing top-tier large caps against the immediate mid-cap tier apply globally, though regulatory frameworks and market depths differ. In the United States, investors analyze similar tier gaps between the S&P 500 and the S&P MidCap 400. While US exchanges are governed by the Securities and Exchange Commission (SEC) and Indian markets operate under the oversight of the Securities and Exchange Board of India (SEBI), the fundamental economic principle remains constant: smaller tier indices carry higher cyclical exposure and demand careful monitoring of valuation bands rather than chasing headline multiples.
Frequently Asked Questions
Does a higher PE ratio always mean an index is overvalued? Not necessarily. A higher PE ratio often reflects stronger expected earnings growth, higher return on equity, or a shift toward growth-oriented sectors within that specific index.
Where can official daily PE ratios be found? Official index valuation metrics, including dividend yields and PE ratios, are published daily on the official website of the National Stock Exchange of India (NSE).
How often are constituents rebalanced? Both the Nifty 50 and Nifty Next 50 undergo periodic semi-annual reviews by the index maintenance committee to ensure accurate representation of market rankings.
This article is for general education and is not investment, tax or financial advice. Rules and figures change — check the official source or a licensed adviser before acting.
This explainer is published by the MoneyPuran desk for general awareness. Rules, limits and rates change over time — please confirm with the official source. Corrections: corrections@moneypuran.com