Money
Money

A divergence defined Wall Street trading as the Dow surged while technology shares on the Nasdaq faced notable selling pressure.

Key points
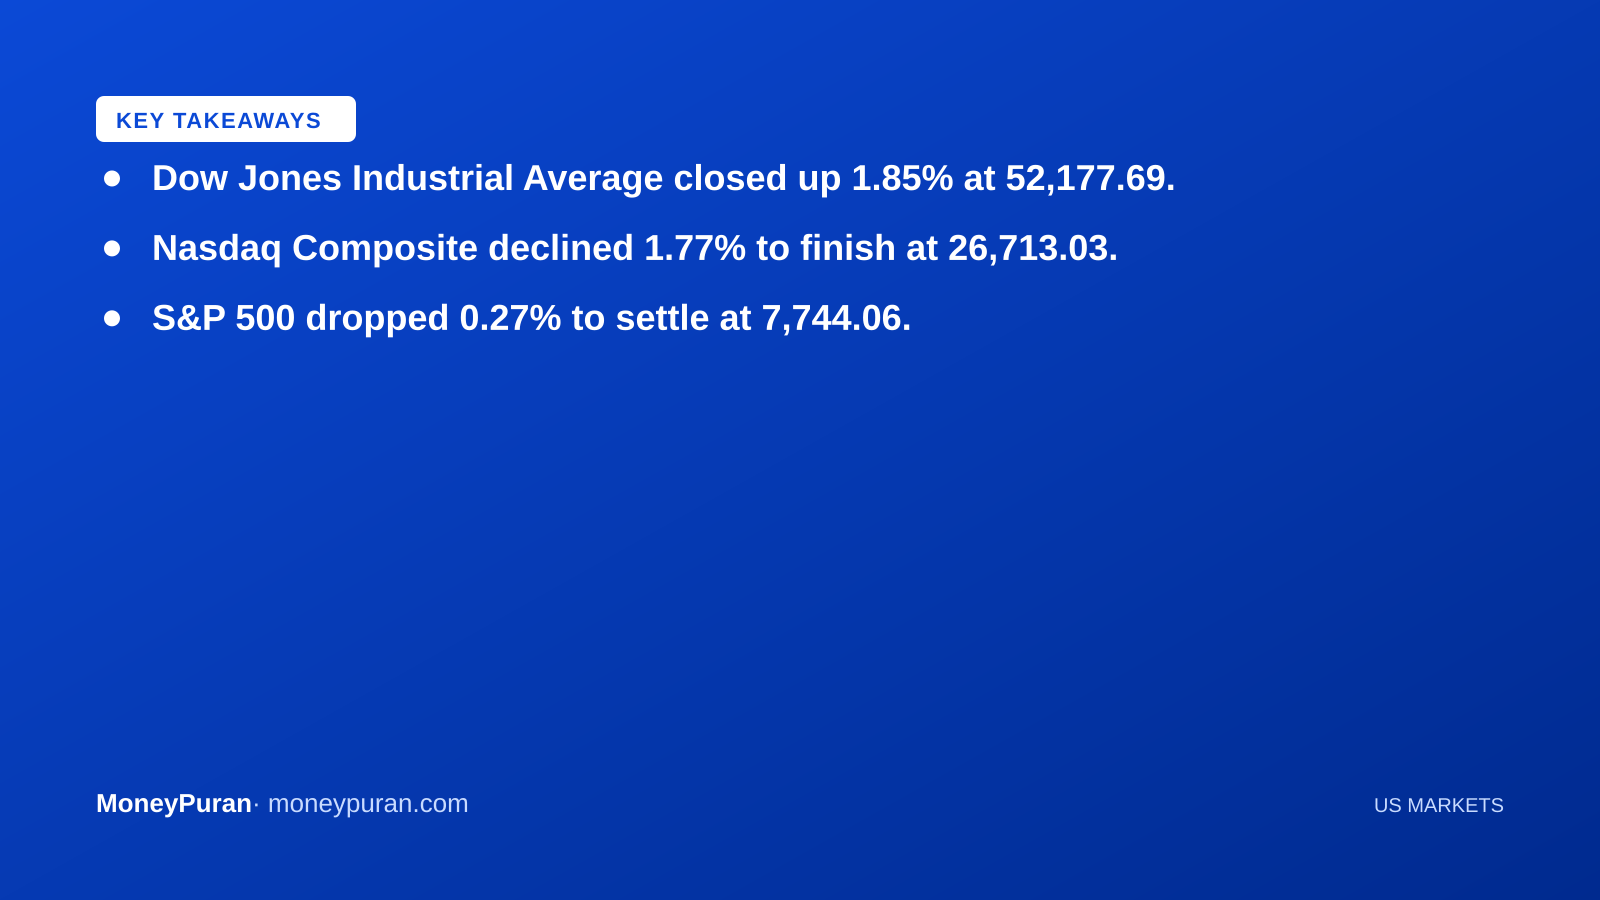
- Dow Jones Industrial Average closed up 1.85% at 52,177.69.
- Nasdaq Composite declined 1.77% to finish at 26,713.03.
- S&P 500 dropped 0.27% to settle at 7,744.06.
- US 10-Year Treasury yield fell 2.96% to 5.09%.
- CBOE Volatility Index (VIX) rose 10.92% to 16.46.
Wall Street experienced a divergent trading session as traditional industrial issues found strong support, while growth and technology shares retreated. The market moves on October 15, 2026, highlighted a clear rotation across major US equity benchmarks, accompanied by a notable drop in Treasury yields and an uptick in market volatility.
Mixed Performance Across Major Indices
The Dow Jones Industrial Average led the major benchmarks, climbing 946.05 points, or 1.85%, to close the session at 52,177.69. The blue-chip index traded within a daily range of 51,681.37 to 52,250.18. In contrast, technology-heavy equities dragged the Nasdaq Composite lower by 480.31 points, or 1.77%, ending the day at 26,713.03 after touching an intraday low of 26,308.85.
The broader S&P 500 slipped 21.30 points, or 0.27%, to finish at 7,744.06, navigating a day range between 7,669.66 and 7,754.15. Meanwhile, small-cap stocks represented by the Russell 2000 index lost 26.86 points, or 0.96%, closing at 2,767.27. Market anxiety measured by the CBOE Volatility Index (VIX) increased by 10.92%, bringing the volatility gauge to 16.46.
Treasury Yields Pull Back
In fixed-income markets, the benchmark US 10-Year Treasury yield experienced a downward move, falling 2.96% to settle at 5.09%. The yield fluctuated within a daily range of 5.04% to 5.11%, pulling back from the previous close of 5.24%. Bond market movements continue to be closely monitored by global investors seeking directional cues on broader macroeconomic conditions and future monetary policy trajectories.
What this means for investors
For international investors and those tracking global cross-border capital flows, divergent sessions between large-cap industrial stocks and technology shares signal shifting sector preferences. When technology indices decline while industrial counterparts rally, portfolio managers often rebalance asset allocations between growth-oriented equities and value-driven sectors.
Changes in US benchmark yields also carry direct implications for emerging market assets and currency valuations, including the Indian rupee. Tracking these broad macroeconomic shifts helps market participants understand international liquidity trends without reacting to single-day market fluctuations.
Frequently asked questions
What caused the divergence between the Dow and Nasdaq? Market data reflects raw index movements and percentage changes only, without attributing specific underlying catalysts to individual sector performances.
How did the US 10-year Treasury yield move? The US 10-Year Treasury yield decreased by 2.96% to finish the session at 5.09%.
This article is for information only and is not investment advice. Do your own research or consult a licensed adviser before investing.
Based on information published by MoneyPuran market data. Source: MoneyPuran market data. Spotted an error? corrections@moneypuran.com