Money
Money

New SEC data reveals a sharp jump in initial public offerings and capital raised during the first half of 2026.

Key points
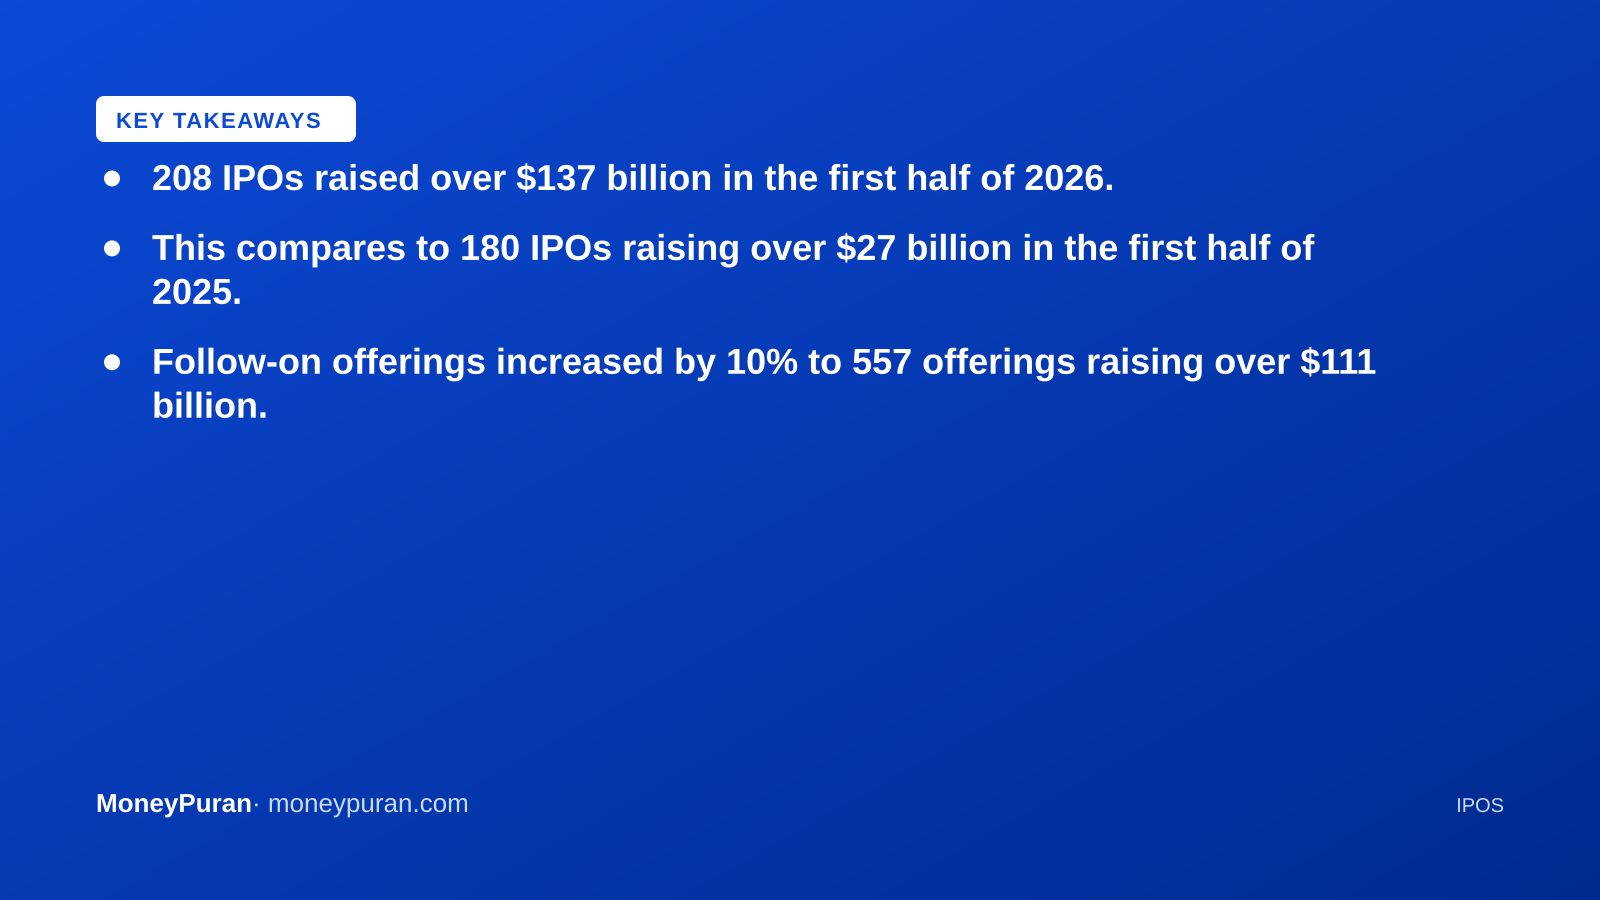
- 208 IPOs raised over $137 billion in the first half of 2026.
- This compares to 180 IPOs raising over $27 billion in the first half of 2025.
- Follow-on offerings increased by 10% to 557 offerings raising over $111 billion.
- Data published by the SEC’s Division of Economic and Risk Analysis (DERA).
Initial public offerings in the United States experienced a dramatic rebound during the first half of 2026, with proceeds surging nearly 400% compared to the same period a year earlier, according to updated market statistics released by the U.S. Securities and Exchange Commission.
Data published by the SEC’s Division of Economic and Risk Analysis (DERA) showed that 208 companies went public during the first six months of the year, raising a combined total exceeding $137 billion. That marks a substantial increase over the first half of 2025, which saw 180 initial public offerings bring in more than $27 billion. The figures represent an approximate 16% rise in the sheer number of market listings alongside the massive leap in capital raised.
Growth in Follow-On Offerings
Beyond initial public offerings, secondary market activity also expanded across the board. Follow-on registered offerings climbed to 557 deals in the first half of 2026, up roughly 10% from the 505 offerings recorded in the corresponding period of 2025. Capital raised through follow-on offerings similarly expanded, growing 33% to top $111 billion, compared to nearly $84 billion previously.
Dr. Joshua T. White, Chief Economist and Director of DERA, pointed to the numbers as evidence of robust capital formation. “DERA’s latest data highlight the continued strengthening of U.S. capital formation under Chairman Atkins, with notable growth in both IPOs and follow‑on offerings,” White stated, emphasizing the division’s commitment to providing transparent and high-quality market analytics.
Accessing SEC Market Statistics
The updated statistics are part of an ongoing effort by DERA to integrate financial economics and rigorous data analytics into the regulatory framework. The agency’s published data visualizations include time series charts tracking multi-year trends, distribution pie charts, and geographic heat maps. These tools are publicly accessible on the SEC website, designed to help investors, market participants, and policymakers evaluate ongoing shifts in capital markets.
What this means for investors
A rising volume of initial public offerings and follow-on share sales points to an active primary market where companies are increasingly confident in testing public valuations. For investors, a busier primary pipeline typically expands the opportunity set for new equity allocations beyond established large-cap stocks. However, heightened primary issuance also requires careful analysis of individual balance sheets, corporate governance disclosures, and valuation multiples before committing capital.
Understanding broader primary market trends helps portfolio managers gauge overall risk appetite and liquidity conditions across major exchanges. While a surge in total proceeds signals healthy corporate funding channels, individual stock performance following a debut often depends on underlying earnings quality rather than aggregate market momentum alone.
Frequently asked questions
How many IPOs occurred in the first half of 2026? There were 208 initial public offerings recorded during the first six months of 2026.
How much capital was raised by IPOs in early 2026? Companies raised over $137 billion through initial public offerings in the first half of 2026, up from $27 billion in the first half of 2025.
This article is for information only and is not investment advice. Do your own research or consult a licensed adviser before investing.
Based on information published by U.S. Securities and Exchange Commission (SEC). Source: U.S. Securities and Exchange Commission (SEC). Spotted an error? corrections@moneypuran.com