 Money

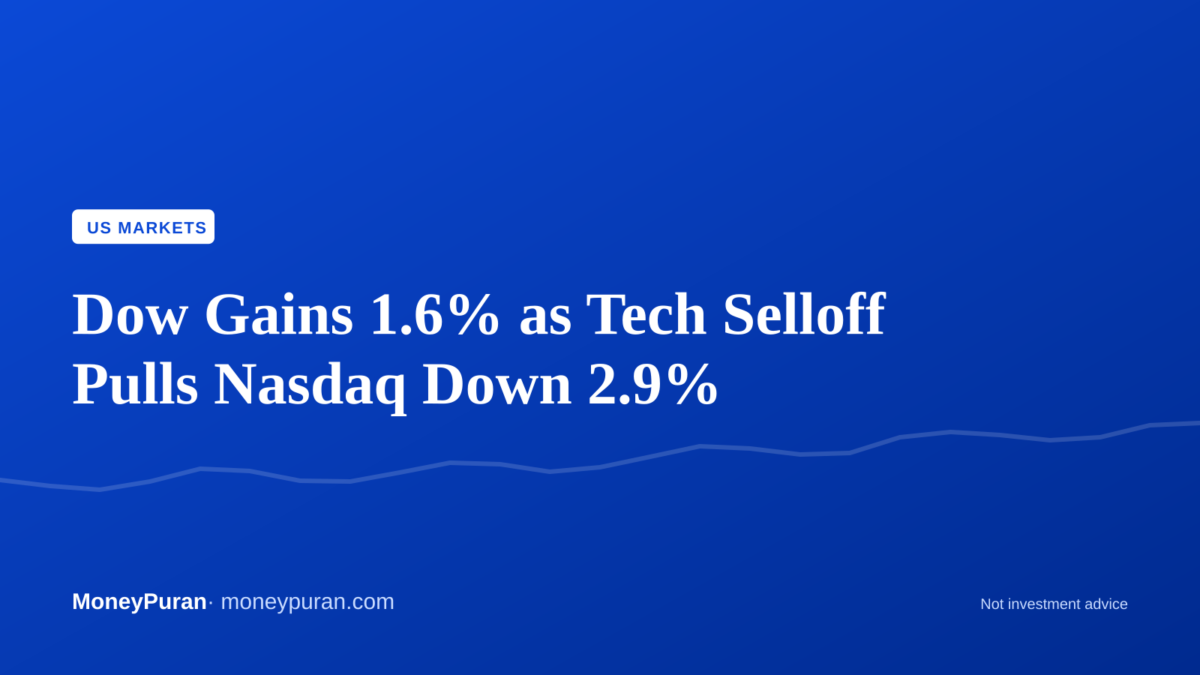
A sharp divergence hit Wall Street on October 20, 2026, as industrial blue chips rallied while technology shares pulled the Nasdaq Composite sharply lower.

Key points
- Dow Jones Industrial Average jumped 1.60% (825.78 points) to close at 52,495.88.
- Nasdaq Composite dropped 2.87% (779.56 points) to finish at 26,424.82.
- S&P 500 fell 1.19% to 7,712.57, weighted down by megacap tech equities.
- US 10-Year Treasury yield declined by 7 basis points to close at 5.12%.
- CBOE Volatility Index (VIX) rose 2.61% to reach 17.31.
A pronounced sector rotation dominated the US stock market on October 20, 2026, creating a striking divergence between traditional industrial stocks and technology equities. While the Dow Jones Industrial Average staged a strong advance of over 800 points, heavy selling across technology sectors pulled the tech-heavy Nasdaq Composite nearly 2.9% lower and dragged the benchmark S&P 500 into negative territory.
A sharp divide on Wall Street
The day trading session highlighted significant structural shifts in equity allocations across Wall Street. Institutional investors diverted capital away from high-valuation technology names into cyclical and value-oriented sectors, giving the Dow Jones Industrial Average a robust push upward while broad market benchmarks struggled under tech weakness.
By the closing bell, major benchmark indices stood as follows:
- Dow Jones Industrial Average: 52,495.88 (+1.60% / +825.78 points)
- S&P 500: 7,712.57 (-1.19% / -92.88 points)
- Nasdaq Composite: 26,424.82 (-2.87% / -779.56 points)
- Russell 2000 (Small Caps): 2,773.42 (-0.36% / -9.95 points)
Bond yields ease while volatility ticks up
Activity in the fixed-income market provided some relief for debt instruments, as the US 10-Year Treasury yield fell by approximately 7 basis points to finish at 5.12%, down from its previous close of 5.19%. Yields fluctuated between a session low of 5.08% and a high of 5.14%.
Equity market volatility expanded alongside the sharp movement in tech equities. The CBOE Volatility Index (VIX), often referred to as Wall Street’s fear gauge, rose 2.61% to settle at 17.31 after testing an intra-day high of 19.13. The elevated VIX level underscores heightened options activity as traders hedged against further downside in growth stocks.
Impact on Indian markets and global spillovers
For investors in India, intense market splits in the US typically generate direct cross-border sentiment implications. A substantial drop in the Nasdaq Composite often weighs on Indian Information Technology shares listed on the NSE and BSE, including major export-heavy firms that rely heavily on US enterprise tech budgets. Early morning trading in Gift Nifty and Indian stock futures frequently mirrors overnight technology sector trends.
Additionally, easing US Treasury yields generally relieve pressure on emerging market currencies, offering short-term support for the Indian Rupee against the US Dollar. Foreign Institutional Investor (FII) equity flows will remain crucial to watch, as sustained global sector rotation can trigger adjustments across global portfolio allocations.
What this means for investors
Divergences of this magnitude illustrate the importance of portfolio diversification across market sectors and asset classes. When megacap growth assets experience pullbacks, cyclical and defensive equities can soften overall portfolio declines if asset allocations are appropriately balanced.
For retail market participants, large intraday swings signal a shifting market structure rather than an immediate systemic issue. Yield declines in government bonds alongside rising stock market volatility suggest investors are actively rebalancing risk parameters rather than exiting equities entirely.
Market participants should keep a close eye on upcoming economic data releases, interest rate signals from central bankers, and corporate earnings reports. Watching sector-specific momentum remains essential for assessing whether tech weakness is a temporary consolidation or a longer-term rotation.
Frequently asked questions
Why did the Dow rise while the Nasdaq dropped? The Dow Jones Industrial Average is price-weighted and heavier in financial, healthcare, and industrial companies, whereas the Nasdaq Composite is heavily weighted in technology and high-growth equities that experienced concentrated selling pressures.
What does a lower 10-year Treasury yield signify? A lower Treasury yield indicates rising bond prices, which often occurs when investors seek safe-haven assets or react to changing expectations around inflation and economic growth.
This article is for information only and is not investment advice. Do your own research or consult a licensed adviser before investing.

Based on information published by MoneyPuran market data. Source: MoneyPuran market data. Spotted an error? corrections@moneypuran.com