Money
Money
The U.S. Bureau of Labor Statistics reported that the Producer Price Index for final demand climbed 1.3 percent in September, driven primarily by a sharp surge in energy costs.
Key points
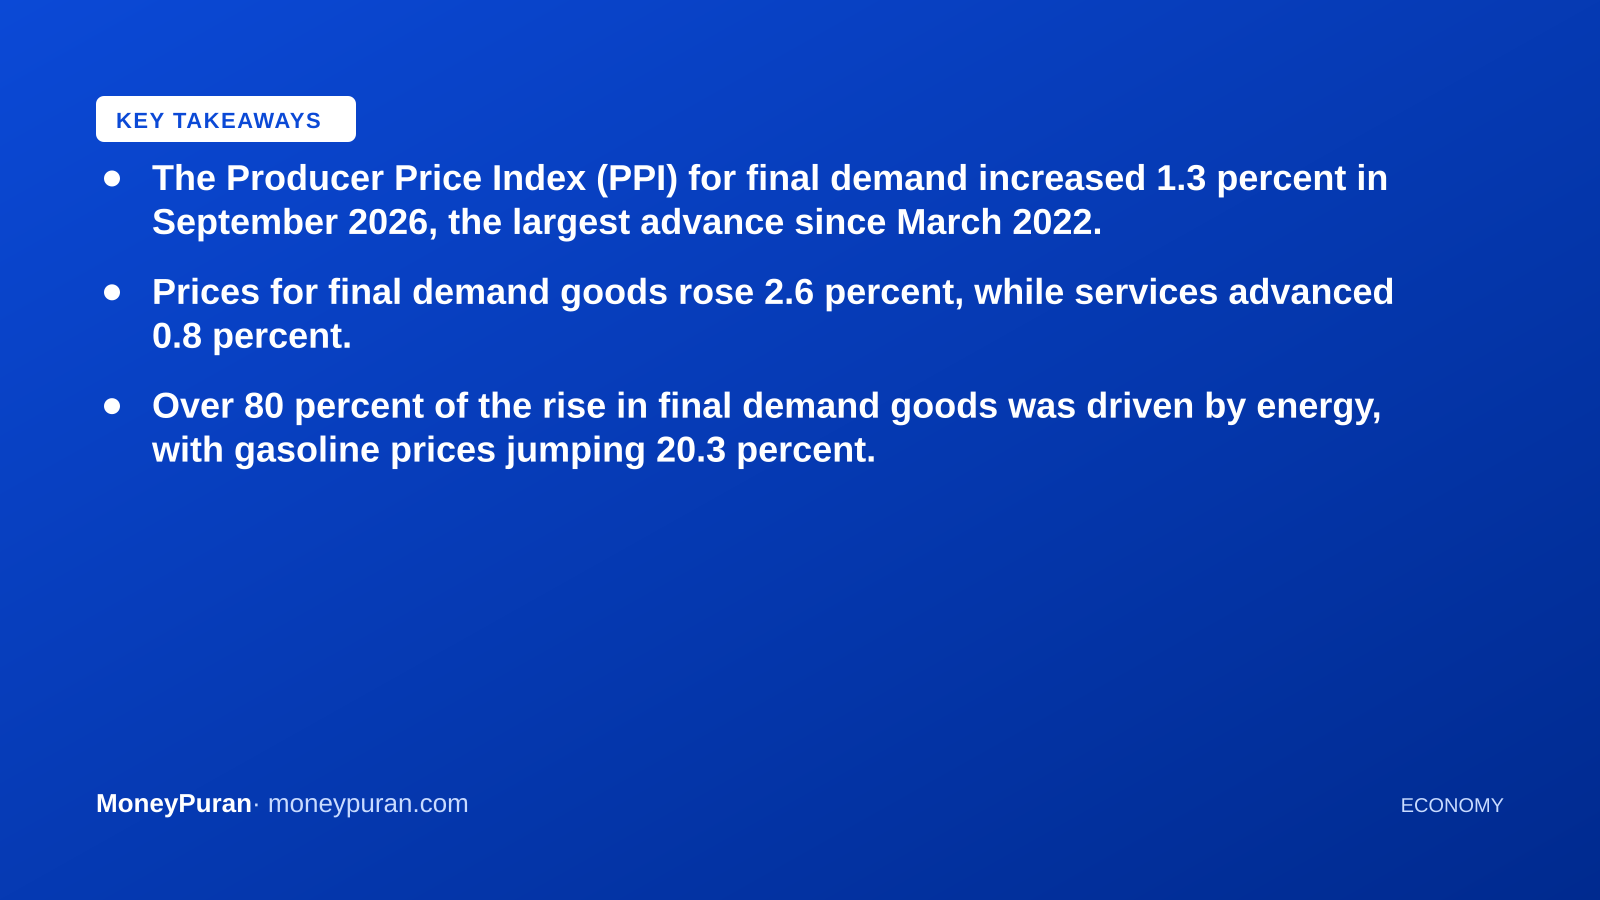
- The Producer Price Index (PPI) for final demand increased 1.3 percent in September 2026, the largest advance since March 2022.
- Prices for final demand goods rose 2.6 percent, while services advanced 0.8 percent.
- Over 80 percent of the rise in final demand goods was driven by energy, with gasoline prices jumping 20.3 percent.
- On an unadjusted basis, the 12-month final demand index climbed 6.3 percent.
U.S. producer prices accelerated significantly in September, driven by broad-based gains led by surging energy costs, according to data released by the U.S. Bureau of Labor Statistics. The Producer Price Index (PPI) for final demand climbed 1.3 percent on a seasonally adjusted basis, following a 0.5 percent increase in August and a 0.2 percent rise in July. This represents the largest monthly advance for the index since it rose 1.7 percent in March 2022.
For the 12 months ended in September, the unadjusted final demand index climbed 6.3 percent, marking the largest annual increase since December 2022. The sharp upward pressure spanned both goods and services, affecting multiple tiers of production before reaching final consumers.
Energy Costs and Goods Drive the Surge
The primary driver behind the September inflation reading was a sharp escalation in goods pricing. Prices for final demand goods advanced 2.6 percent during the month, which is the largest increase recorded since data collection began in December 2009. The Bureau of Labor Statistics noted that more than 80 percent of this broad-based rise stemmed from the final demand energy index, which jumped 10.8 percent.
Product details highlight gasoline as a major contributor, surging 20.3 percent and accounting for half of the total increase in final demand goods. Diesel fuel, jet fuel, residential electric power, and crude petroleum also registered notable increases. Conversely, prices for chicken eggs dropped sharply by 39.7 percent, offering some relief alongside declines in thermoplastic resins.
Services and Intermediate Demand Pressures
Prices for final demand services moved up 0.8 percent in September, representing the largest monthly rise since April. Nearly half of this increase was attributed to a 1.4 percent rise in trade services margins. Machinery and vehicle wholesaling played a prominent role, jumping 3.9 percent, alongside gains in freight trucking and airline passenger services.
Further down the production pipeline, intermediate demand figures showed steep upward momentum. Processed goods for intermediate demand rose 2.5 percent, while unprocessed goods jumped 8.4 percent, fueled by a 22.2 percent surge in unprocessed energy materials. Crude petroleum prices within the intermediate category advanced 28.3 percent.
What this means for investors
Wholesale inflation metrics such as the PPI are closely watched by market participants because pipeline cost pressures often pass through to consumer prices over time. A sharper-than-expected increase in producer costs can influence central bank monetary policy expectations, particularly regarding interest rate trajectories and future inflation containment efforts.
For global investors, higher U.S. energy and wholesale input costs can influence currency valuations, bond yields, and equity sector performance. When input costs rise rapidly, profit margins for manufacturing, transport, and retail companies may face compression unless firms successfully pass these higher expenses on to end consumers. Market participants routinely monitor these reports alongside consumer price indexes to gauge macroeconomic health and potential monetary policy shifts.
Frequently asked questions
What is the Producer Price Index? The PPI measures the average change over time in selling prices received by domestic producers for their goods, services, and construction.
How does PPI differ from the Consumer Price Index? While the CPI measures price changes from the perspective of the purchaser or consumer, the PPI measures inflation from the perspective of the seller or producer.
This article is for information only and is not investment advice. Do your own research or consult a licensed adviser before investing.
Based on information published by U.S. Bureau of Labor Statistics (BLS). Source: U.S. Bureau of Labor Statistics (BLS). Spotted an error? corrections@moneypuran.com