Money
Money

We unpack the data behind popular calendar anomalies like the Santa Claus rally, the January effect, and Sell in May to see if they hold up for investors.
Key points
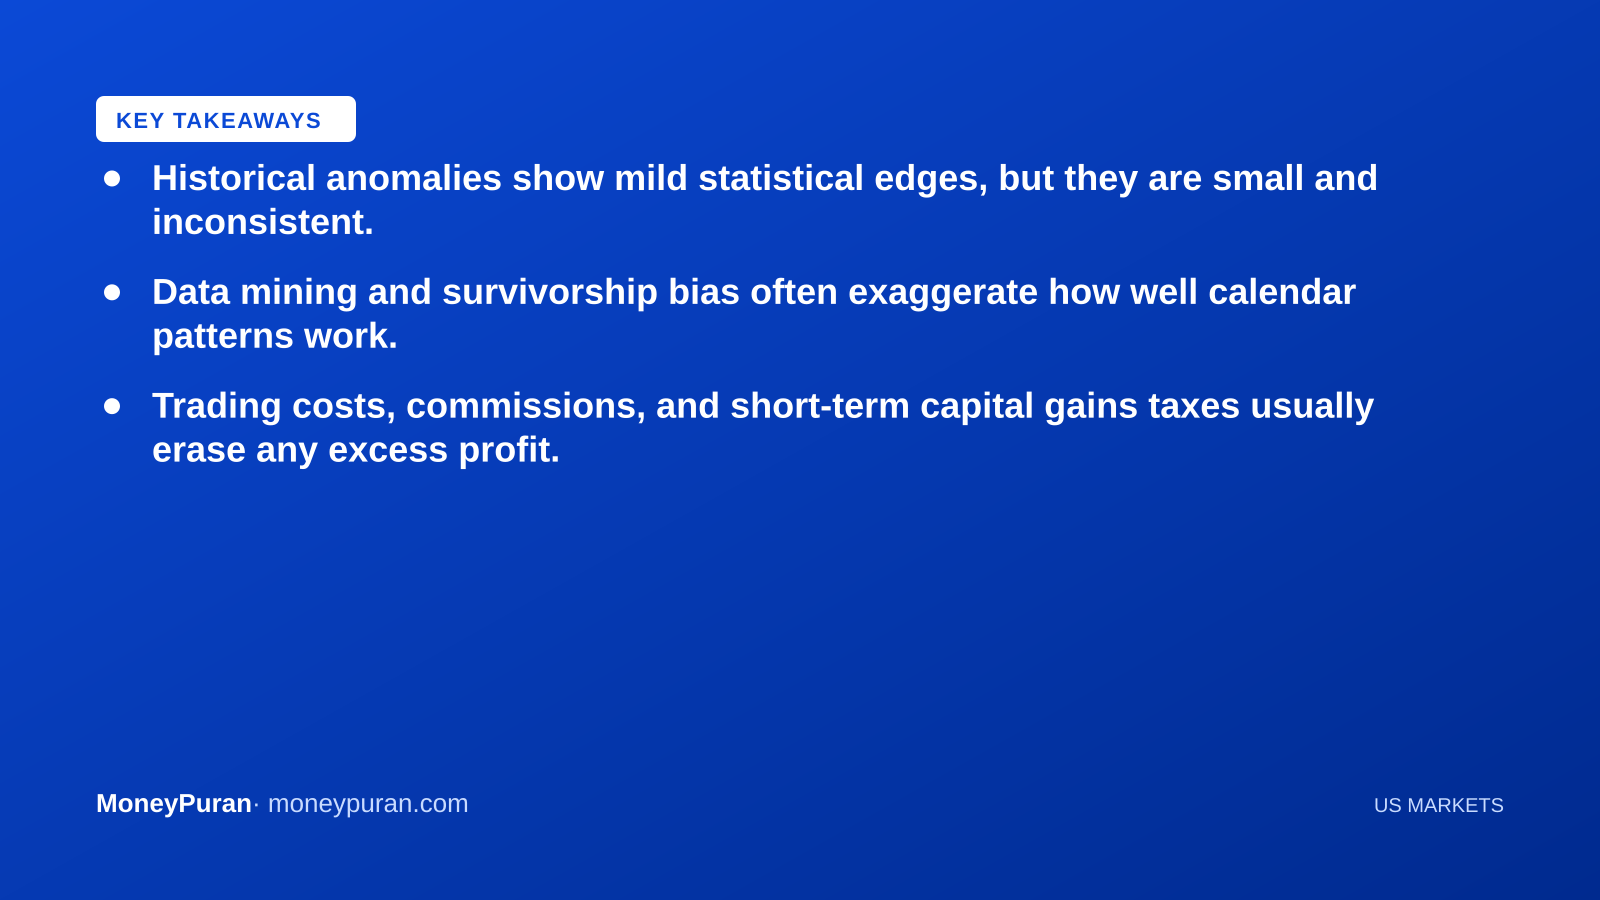
- Historical anomalies show mild statistical edges, but they are small and inconsistent.
- Data mining and survivorship bias often exaggerate how well calendar patterns work.
- Trading costs, commissions, and short-term capital gains taxes usually erase any excess profit.
- Long-term consistent investing almost always outperforms trying to time short-term seasonal shifts.
When December rolls around, financial media loves to talk about the ‘Santa Claus rally’—the notion that stocks reliably gain during the final five trading days of the year and the first two days of the new year. Other calendar patterns, such as ‘Sell in May and go away’ or the ‘January effect’ in small-cap stocks, are trotted out with equal regularity. But do these predictable shifts in stock market seasonality actually work, or are they nothing more than market folklore?
The most famous calendar anomalies
Market observers have cataloged dozens of recurring calendar patterns over the decades. The Santa Claus rally is perhaps the most famous, alongside the broader winter strength phenomenon where equities tend to perform better between November and April than they do from May to October. Another classic is the January effect, where smaller companies historically outpace large-cap benchmarks during the first month of the year following tax-loss harvesting in December.
While long-term historical data sometimes shows a positive average return for these periods, averages can be deeply misleading. An anomaly might hold true across a 50-year aggregate while failing completely in any given single year, leaving investors exposed to unexpected drawdowns.
Why historical patterns are unreliable
The primary danger with relying on stock market seasonality is data mining. If you test thousands of calendar combinations against decades of historical price data, you are mathematically guaranteed to find patterns that worked by pure random chance in the past, even if they have no economic reason to repeat.
Furthermore, markets evolve. Once a profitable pattern becomes widely known and written about in textbooks or financial blogs, institutional algorithmic traders step in to arbitrage away the discrepancy. What used to be an easy edge disappears as prices adjust instantly to new information.
The hidden costs of trying to time the calendar
Even if a mild seasonal edge exists in raw price data, capturing it in the real world is notoriously difficult. When you factor in transaction costs, bid-ask spreads, and potential management fees, the marginal profit often vanishes entirely.
More importantly, tax implications can ruin a seasonal strategy. Selling your portfolio in May to avoid summer losses triggers a taxable event in taxable accounts (such as standard US brokerage accounts or Indian taxable capital gains profiles). Paying capital gains tax immediately will almost always drag down your long-term compounding far more than sitting out a brief summer slump would ever save you.
Cross-border perspective: US and India
Calendar anomalies are studied globally, but local market structures matter immensely. In the United States, tax-loss harvesting toward the end of December genuinely influences year-end flows. In India, fiscal year mechanics run from April to March, meaning mutual fund flows and institutional rebalancing often follow a completely different calendar rhythm.
Regardless of geography, regulators across the globe urge caution regarding any strategy promising market-beating returns based purely on the calendar. For verified regulatory guidance on investor protection, you can consult official resources like the US Securities and Exchange Commission (SEC) or the Securities and Exchange Board of India (SEBI).
Frequently asked questions
Are stock market seasonal patterns guaranteed to happen? No. They are merely historical averages, not rules. Any individual year can—and frequently does—buck the trend entirely.
Should I sell my stocks in May? Generally, no. Missing out on unexpected summer gains while incurring taxes and trading fees usually hurts long-term returns.
Why do people still talk about these patterns? They provide easy, engaging headlines for financial media during slow news cycles, but they are best viewed as trivia rather than an actionable investment strategy.
This article is for general education and is not investment, tax or financial advice. Rules and figures change — check the official source or a licensed adviser before acting.
Official information: https://www.investor.gov
This explainer is published by the MoneyPuran desk for general awareness. Rules, limits and rates change over time — please confirm with the official source. Corrections: corrections@moneypuran.com