Money
Money
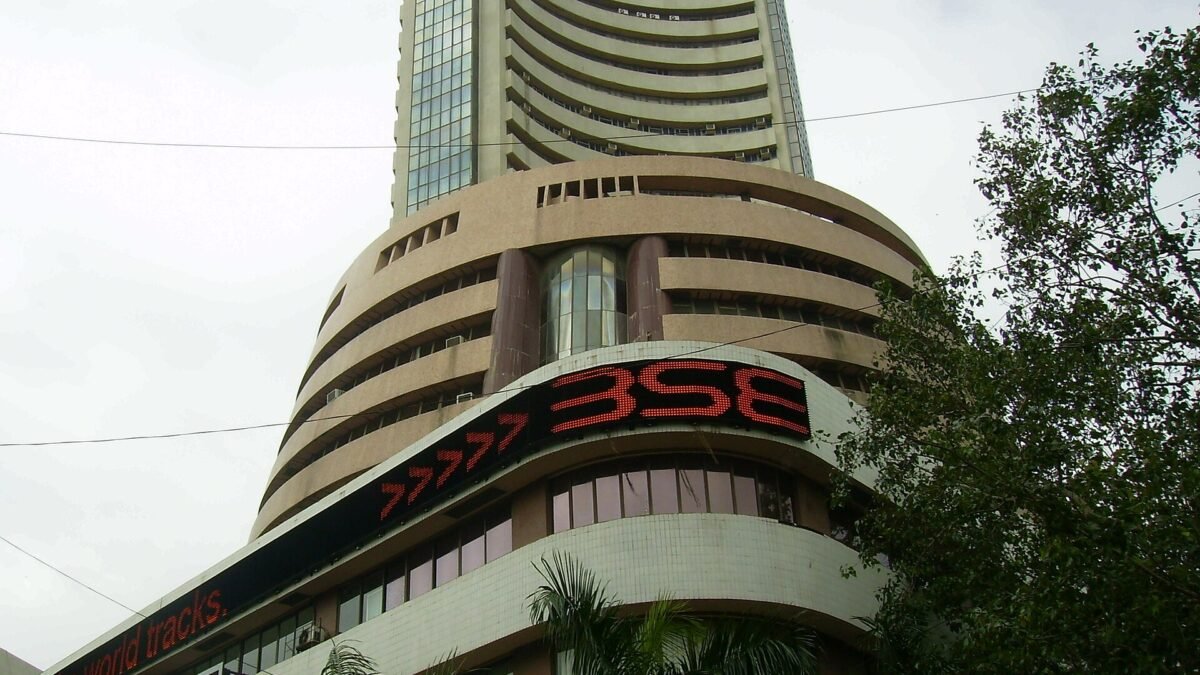
Benchmarks Sensex and Nifty 50 recorded sharp losses during the trading session, dragged down alongside heavy selling across major sectoral gauges.
Key points
- BSE Sensex dropped 1.82% to close at 74,764.23 on September 9, 2026.
- Nifty 50 fell 1.85% to settle at 23,431.50.
- Nifty Bank declined 1.89% to finish the session at 56,295.55.
- USD/INR exchange rate rose 0.64% to trade at 95.10.
The Indian stock market experienced a broad-based selloff during the trading session on September 9, 2026, as major domestic indices recorded steep percentage declines. Benchmark indices retreated significantly from previous closing levels, reflecting heightened caution among market participants trading on both the Bombay Stock Exchange and the National Stock Exchange. Selling pressure was evident across multiple sectors, pulling headline gauges down to their respective intraday lows by the closing bell.
According to official market data released for the session, the BSE Sensex fell 1,388.63 points, or 1.82%, to close at 74,764.23. The index moved within a daily range of 74,764.23 to 75,251.23, failing to hold above key psychological thresholds throughout the day. Similarly, the broader NSE Nifty 50 index dropped 441.95 points, or 1.85%, to settle at 23,431.50, with an intraday trading range spanning between 23,431.50 and 23,571.55.
Key index movements across the Indian stock market
Financial and banking equities faced pronounced downward momentum during the session, contributing heavily to the broader market retreat. The Nifty Bank index declined by 1.89%, losing 1,085.05 points to finish at 56,295.55 after touching an intraday high of 56,743.05. Currency markets also witnessed notable activity alongside the equity downturn, with the US dollar strengthening against the rupee. The USD/INR exchange rate advanced 0.64%, moving up to 95.10 with a recorded daily trading range between 94.80 and 95.22.
- BSE Sensex close: 74,764.23 (down 1.82%)
- Nifty 50 close: 23,431.50 (down 1.85%)
- Nifty Bank close: 56,295.55 (down 1.89%)
- USD/INR rate: 95.10 (up 0.64%)
What this means for investors
Sharp market corrections like the one seen across the Indian stock market often prompt heightened volatility and reassessment of portfolio risk among institutional and retail participants. When benchmark indices experience declines of nearly two percent in a single session, margin requirements, derivative positions, and sector allocations can face immediate stress. Investors typically monitor support levels, foreign institutional investor flow data, and macroeconomic indicators closely during such periods to gauge whether a downturn represents a temporary pullback or the beginning of a broader downward trend.
Navigating significant market drops requires a disciplined approach, focusing on long-term financial goals rather than reacting to single-session volatility. Diversification across asset classes and maintaining adequate liquidity help cushion portfolios against sudden macroeconomic shocks or currency fluctuations. Market participants often look toward upcoming central bank announcements, corporate earnings reports, and fiscal data releases to understand the broader economic trajectory following steep index contractions.
Frequently asked questions
What caused the sharp decline in the Indian stock market? Market data reflects the final index levels and percentage moves without attributing specific external catalysts, though broad-based selling and currency adjustments influenced the session.
How do currency movements impact domestic equities? Movements in exchange rates, such as the USD/INR pair rising, can influence foreign capital flows, import costs for domestic corporations, and overall investor sentiment.
This article is for information only and is not investment advice. Do your own research or consult a licensed adviser before investing.
Based on information published by MoneyPuran market data. Source: MoneyPuran market data. Spotted an error? corrections@moneypuran.com