Money
Money
BSE Sensex drops 1.30 percent while Nifty 50 slips 0.57 percent, as banking indices hold resilient and the rupee gains slightly.
Key points
- BSE Sensex dropped 1.30% to close at 75,577.58, down from its previous close of 76,570.35.
- Nifty 50 fell 0.57% to finish at 23,779.20, after trading within a daily range of 23,623.10 to 23,758.95.
- Nifty Bank saw a minor decline of 0.15% to settle at 57,088.30.
- USD/INR currency pair fell 0.15% to 94.82, reflecting modest strengthening in the Indian rupee.
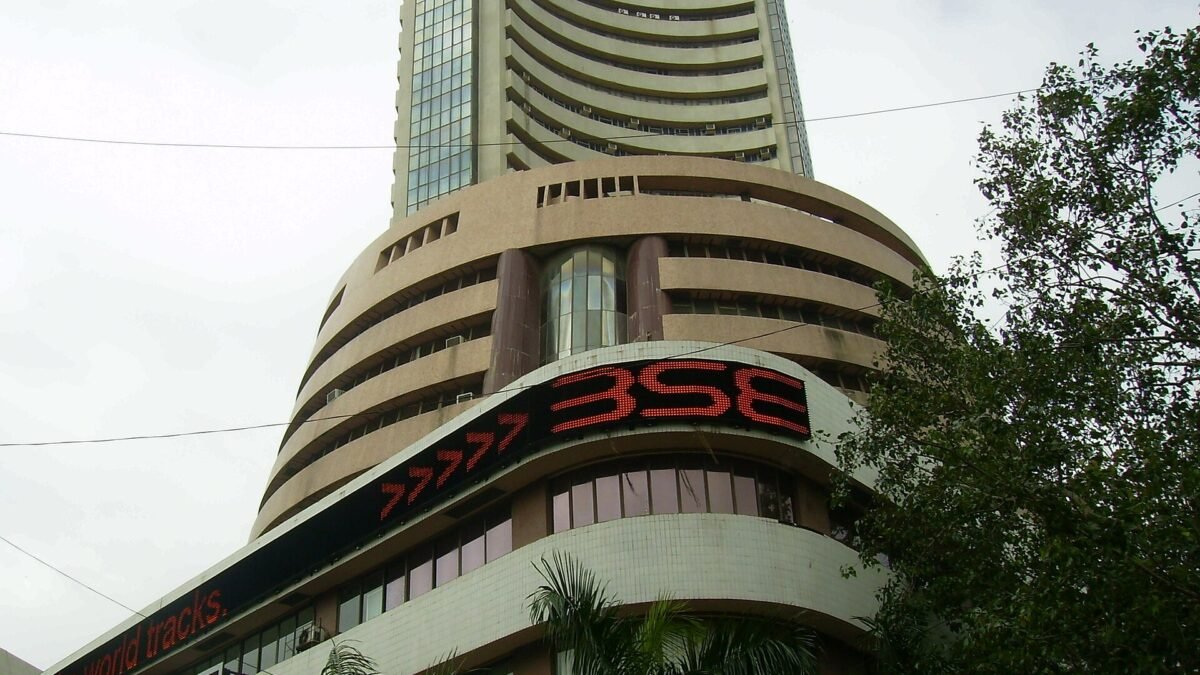
The Indian stock market ended lower on September 8, 2026, as headline equity benchmarks faced selling pressure throughout the trading session. India’s benchmark BSE Sensex registered the most significant drop among major domestic indicators, falling by more than one percent, while the broader Nifty 50 index also posted notable losses. Financial institutions saw a relatively modest decline, with the Nifty Bank index slipping slightly. Meanwhile, the Indian rupee posted modest gains against the United States dollar, reflecting subtle currency adjustments alongside equities.
Key numbers driving the Indian stock market today
Market participant activity across national trading exchanges reflected cautious positioning. Below are the key closing statistics for major domestic benchmark indices and foreign currency exchange rates recorded at the end of the trading day:
- BSE Sensex: Closed down by 1.30 percent at 75,577.58 points, compared to a previous close of 76,570.35 points, after trading within an intraday range of 75,553.35 to 76,012.11 points.
- Nifty 50: Finished at 23,779.20 points, declining 0.57 percent from its previous session level of 23,914.45 points, following an intraday range between 23,623.10 and 23,758.95 points.
- Nifty Bank: Ended lower by 0.15 percent at 57,088.30 points, down from its prior close of 57,172.00 points, having moved between 56,720.45 and 57,044.00 points during the day.
- USD / INR Currency Pair: Settled at 94.82, down 0.15 percent from the prior close of 94.96, having fluctuated within a daily range of 94.48 to 94.89.
Understanding benchmark equity indices in the Indian stock market
Benchmark equity indices serve as primary barometers for evaluating general financial sentiment across the Indian stock market. The BSE Sensex, composed of 30 well-established companies listed on the Bombay Stock Exchange, provides a concentrated measure of large-cap corporate health. When large constituent stocks experience downward pressure, the Sensex often reflects noticeable percentage moves due to its market-capitalization weighting structure.
On the National Stock Exchange, the Nifty 50 offers a broader perspective by measuring performance across 50 diversified blue-chip corporations representing critical sectors such as information technology, consumer goods, energy, and industrial manufacturing. On September 8, 2026, the Nifty 50 demonstrated relatively greater resilience than the Sensex, dropping by 0.57 percent compared to the headline BSE index drop of 1.30 percent. This divergence suggests that losses were concentrated among specific mega-cap constituents that carry heavier weights inside the Sensex structure.
Role of banking stocks and currency dynamics
Financial institutions represent one of the heaviest sector weightings within major domestic stock benchmarks. The Nifty Bank index, which aggregates leading public and private sector lenders, acts as a crucial barometer for systemic liquidity, credit growth expectations, and overall corporate borrowing health. During the trading session on September 8, 2026, the Nifty Bank index posted a modest loss of 0.15 percent, outperforming the main headline indices and helping stabilize broader market floors.
Simultaneously, foreign currency movements remain tightly linked to international institutional capital flows into the Indian stock market. A strengthening or weakening currency directly influences export competitiveness for technology and pharmaceutical firms while altering input costs for import-dependent sectors such as energy and manufacturing. On September 8, 2026, the US dollar to Indian rupee (USD/INR) cross exchange rate adjusted slightly downward to 94.82, reflecting a 0.15 percent firming of the rupee relative to its previous close of 94.96.
Investor considerations during equity market pullbacks
Normal daily fluctuations across equity benchmarks are a standard feature of functioning public capital markets. Short-term declines in major indices often reflect institutional rebalancing, profit-taking following extended rallies, or broader global macroeconomic recalibrations. For individual investors maintaining long-term financial plans, understanding market structure and index behavior helps insulate portfolio strategy from daily headline volatility.
Systematic investment techniques, regular asset allocation reviews, and maintaining realistic risk tolerance remain foundational practices for navigating long-term cycles in the Indian stock market. Diversification across asset classes—including equities, fixed income, commodities, and real assets—can help cushion portfolios when specific equity indices undergo short-term corrections.
Frequently asked questions
What were the closing levels for major indices on September 8, 2026? The BSE Sensex closed at 75,577.58 points (down 1.30%), the Nifty 50 closed at 23,779.20 points (down 0.57%), and the Nifty Bank finished at 57,088.30 points (down 0.15%).
How did the US dollar perform against the Indian rupee? The USD/INR pair fell 0.15% to close at 94.82, indicating a minor strengthening of the Indian rupee compared to the previous close of 94.96.
Why do the Sensex and Nifty 50 move by different percentages? The BSE Sensex contains 30 mega-cap companies, whereas the Nifty 50 includes 50 large-cap companies. Differences in component weighting and sector distribution lead to varying daily percentage performance between the two indices.
This article is for information only and is not investment advice. Do your own research or consult a licensed adviser before investing.
Based on information published by MoneyPuran market data. Source: MoneyPuran market data. Spotted an error? corrections@moneypuran.com