Money
Money

Wall Street indices delivered a split performance as technology gains offset Dow losses while Treasury yields ticked up.
Key points
- The S&P 500 slipped 0.16% to close at 7,673.52, while the Dow Jones dropped 0.75% to 52,786.07.
- The Nasdaq Composite advanced 0.19% to 26,421.41, supported by technology strength.
- Small-cap Russell 2000 edged up 0.13% to finish the session at 2,960.20.
- The US 10-Year Treasury yield rose to 4.81% and the CBOE Volatility Index (VIX) increased 3.42% to 15.72.
US stock market finishes session with mixed index signals
The US stock market recorded a mixed session on September 8, 2026, as technology shares provided modest support to equity benchmarks while blue-chip industrial equities experienced selling pressure. Major financial market benchmarks reflected contrasting investor sentiment throughout the trading day, leading to divergent outcomes across key indexes.
During Tuesday’s session, market participants navigated a split trading environment where mega-cap technology strength helped cushion broader market indexes. Meanwhile, broader macroeconomic variables including benchmark Treasury yields and market volatility measures edged higher, keeping overall equity gains in check across Wall Street.
Broad market trading saw participation distributed unevenly across sectors. Defensive sectors and heavy industrials faced headwinds as investors re-evaluated interest rate expectations in light of firming bond yields. Conversely, growth-oriented market segments maintained buyer interest, helping prevent wider declines across broader equity indexes.
Detailed performance of the US stock market indexes
A closer examination of benchmark performances shows that the broad S&P 500 index declined moderately, shedding 0.16% to close at 7,673.52 after trading within a daily channel between 7,666.99 and 7,717.81. The Dow Jones Industrial Average lagged behind the broader market, dropping 0.75% or nearly 400 points to finish at 52,786.07.
In contrast, tech-heavy equities managed to gain ground. The Nasdaq Composite advanced 0.19% to end at 26,421.41, oscillating between an intraday low of 26,341.17 and a high of 26,542.14. Small-cap equities also demonstrated resilience, with the Russell 2000 index moving up 0.13% to close at 2,960.20.
- S&P 500: Closed at 7,673.52, down 0.16% (-12.62 points) from the previous close of 7,686.14.
- Dow Jones Industrial Average: Ended at 52,786.07, down 0.75% (-399.83 points) from 53,185.90.
- Nasdaq Composite: Finished at 26,421.41, up 0.19% (+50.52 points) from 26,370.89.
- Russell 2000: Settled at 2,960.20, rising 0.13% (+3.75 points) from 2,956.45.
- CBOE Volatility Index (VIX): Rose 3.42% to 15.72 from 15.20.
- US 10-Year Treasury Yield: Increased to 4.81%, up 0.21% from 4.80%.
Factors driving US stock market sentiment and bond yields
Fixed-income assets saw yields edge upward during the session, with the benchmark US 10-Year Treasury yield advancing to 4.81%. Treasury yield fluctuations frequently influence equity market valuation models, particularly for dividend-paying companies and capital-intensive sectors. Higher bond yields can make fixed-income instruments relatively more attractive to risk-averse investors compared to stocks.
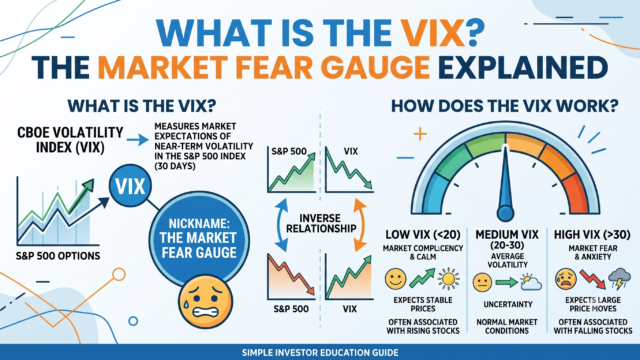
Equity market volatility also ticked upward during the day’s session. The CBOE Volatility Index, often referred to as Wall Street’s fear gauge, rose 3.42% to settle at 15.72. Although a VIX reading below 20 generally indicates moderate market anxiety, the incremental rise highlights a subtle increase in hedging demand among options traders positioning for short-term market fluctuations.
The relationship between fixed-income yields and equity price-to-earnings multiples remains a central focal point for market observers. When government bond yields move higher, discount rates applied to future earnings expectations increase, which can disproportionately weigh on high-valuation growth companies unless offset by strong corporate earnings expansion.
Understanding how equity indexes shape portfolio strategies in the US stock market
For individual investors and institutional managers, tracking market indicators like the S&P 500, Dow Jones, and Nasdaq Composite provides essential context for asset allocation decisions. The S&P 500 represents roughly 80% of available market capitalization in the United States, serving as a primary benchmark for core equity exposure in modern portfolios.
Divergences between price-weighted indexes like the Dow Jones Industrial Average and market-capitalization-weighted indexes like the Nasdaq occur regularly. Because price-weighted indexes give greater weight to higher-priced stock shares rather than total company value, single-stock movements among high-priced constituent components can create stark differences in relative daily returns across major benchmark indexes.
Frequently asked questions
What caused the divergence in the US stock market today? The divergence was driven by relative strength in technology components lifting the Nasdaq Composite while industrial and traditional blue-chip equities weighed on the Dow Jones Industrial Average.
How did bond yields impact stock movements during the session? The 10-Year US Treasury yield rose to 4.81%, which often exerts downward pressure on stock valuations as higher risk-free yields alter discounted cash flow models for corporate equities.
What does a VIX reading of 15.72 indicate for investors? A CBOE Volatility Index reading of 15.72 suggests moderate market volatility, well below historic panic levels but reflecting a slight increase in short-term options hedging activity.
This article is for information only and is not investment advice. Do your own research or consult a licensed adviser before investing.
Based on information published by MoneyPuran market data. Source: MoneyPuran market data. Spotted an error? corrections@moneypuran.com