Money
Money
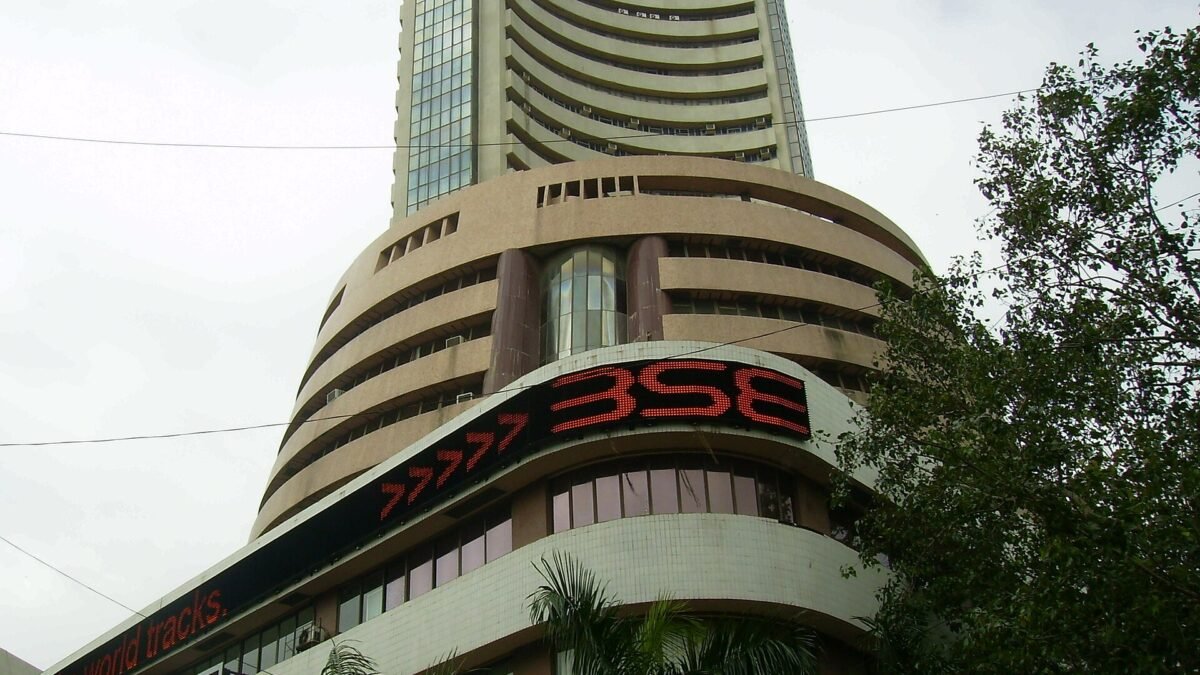
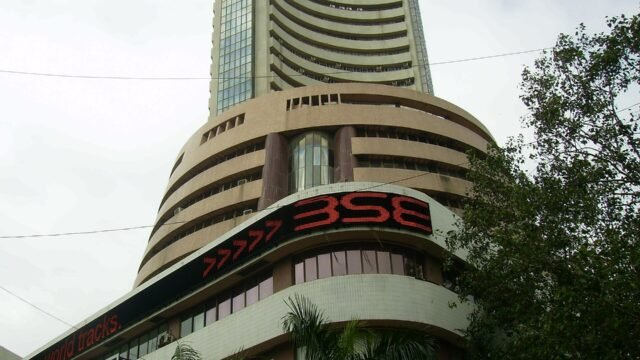
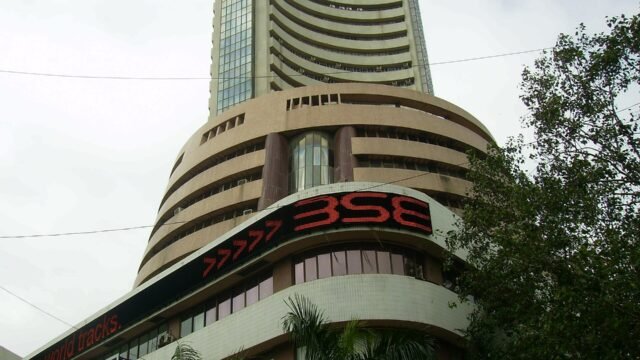
Indian stock benchmarks ended lower on September 3, 2026, as the BSE Sensex fell 1.44% and the Nifty 50 lost 1.25%.
Key points
- BSE Sensex fell 1.44% to close at 76,152.86 points, down from 77,264.51.
- Nifty 50 dropped 1.25% to finish at 23,873.45 points.
- Nifty Bank showed relative stability, declining just 0.20% to 57,380.60.
- USD/INR exchange rate fell 1.04% to close at 94.48.
The Sensex today experienced significant selling pressure on September 3, 2026, as headline equity indices across the Indian stock market recorded notable declines by the closing bell. Both the BSE Sensex and the NSE Nifty 50 ended the trading session in negative territory, reflecting broad-based weakness in domestic equities. Meanwhile, banking stocks displayed relative resilience compared to the broader market, while the Indian Rupee registered a decline against the United States Dollar in foreign exchange trading.
Sensex today closes lower alongside major benchmarks
The flagship BSE Sensex index closed at 76,152.86 points, marking a drop of 1.44 percent or over 1,100 points compared to its previous close of 77,264.51. During the session, the Sensex moved within an intraday range of 76,152.86 to 76,924.48, touching its lowest level of the day at the official close.
Similarly, the broader Nifty 50 index dropped 1.25 percent to settle at 23,873.45 points, down from its previous session finish of 24,175.65. The Nifty 50 oscillated between an intraday low of 23,873.45 and a high of 24,025.40 before finishing at the lower end of its daily band.
The banking sector showed comparatively modest losses. The Nifty Bank index slipped 0.20 percent to close at 57,380.60 points, compared to the prior closing level of 57,496.30. Throughout the session, the banking gauge moved between a low of 57,380.60 and a high of 57,753.60. In currency markets, the USD/INR currency pair traded at 94.48, representing a 1.04 percent decrease from the previous level of 95.47, within a daily trading range of 94.27 to 94.96.
Key summary of benchmark index movements
Here is a breakdown of the key statistical figures recorded at the market close on September 3, 2026:
- BSE Sensex: 76,152.86 (-1.44%, down from 77,264.51; day range: 76,152.86 – 76,924.48)
- Nifty 50: 23,873.45 (-1.25%, down from 24,175.65; day range: 23,873.45 – 24,025.40)
- Nifty Bank: 57,380.60 (-0.20%, down from 57,496.30; day range: 57,380.60 – 57,753.60)
- USD / INR Exchange Rate: 94.48 (-1.04%, down from 95.47; day range: 94.27 – 94.96)
Understanding Sensex today and how equity indices function
For market observers analyzing the Sensex today, understanding how benchmark indices operate provides critical context for interpreting daily price movements. The BSE Sensex, established by the Bombay Stock Exchange, is a free-float market-capitalization-weighted index comprising 30 of the largest and most financially sound companies listed in India. These companies span key sectors of the Indian economy, including information technology, financial services, consumer goods, energy, and industrial manufacturing.
The Nifty 50 index, managed by the National Stock Exchange of India, follows a similar free-float weighting methodology but incorporates 50 large-cap stocks. Because both indices cover a significant proportion of total market capitalization, daily percentage changes in the Sensex and Nifty serve as primary barometers for broader equity sentiment across domestic financial markets. When tracking the Sensex today, market participants examine key support and resistance levels to gauge short-term sentiment across various market sectors.
Role of macroeconomic factors and market liquidity
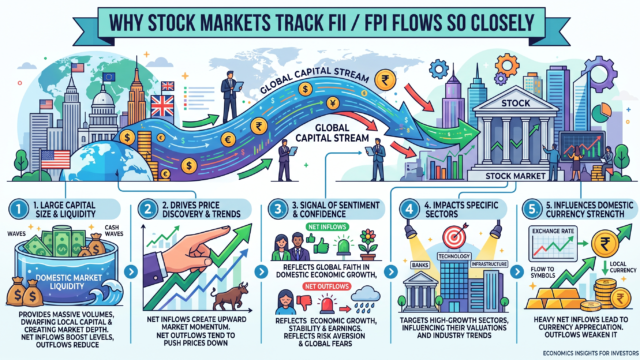
Equity price movements on any given trading day are influenced by a complex interplay of domestic and global economic signals. Institutional investors, including foreign portfolio investors and domestic institutional investors, adjust their capital allocations based on variables such as interest rate expectations set by central banks like the Reserve Bank of India and the US Federal Reserve, corporate earnings trajectories, crude oil price shifts, and inflation data.
In addition, currency trends play a direct role in shaping investor behavior. Fluctuations in the USD/INR rate affect export-driven sectors such as software services and pharmaceuticals differently than import-dependent industries like refining and consumer electronics. A strengthening or weakening currency directly impacts profit margin expectations for multinational corporations operating within the country, influencing overall stock market performance.
What daily equity fluctuations mean for long-term investors
Daily index moves, such as the downturn observed in headline figures, represent short-term price discovery in response to liquidity dynamics, news flow, and global market trends. Financial advisers frequently emphasize that single-day market pullbacks are routine components of capital market behavior rather than long-term economic indicators.
Maintaining a disciplined investment approach often involves regular asset allocation reviews and systematic investment plans. By spreading capital contributions across time, investors mitigate the risks associated with timing market peaks and troughs. Diversification across asset classes, including fixed income, commodities, and equities, remains a foundational strategy to buffer investment portfolios against heightened market volatility.
Frequently asked questions
What was the closing level of the BSE Sensex on September 3, 2026? The BSE Sensex closed at 76,152.86 points, declining 1.44 percent from its previous close of 77,264.51.
How did the Nifty Bank perform relative to the main indices? The Nifty Bank index experienced a smaller loss than the broader indices, declining 0.20 percent to close at 57,380.60 points.
What was the USD/INR currency exchange rate at the close? The USD/INR pair ended the session at 94.48, down 1.04 percent from the prior close of 95.47.
This article is for information only and is not investment advice. Do your own research or consult a licensed adviser before investing.
Based on information published by MoneyPuran market data. Source: MoneyPuran market data. Spotted an error? corrections@moneypuran.com