Money
Money
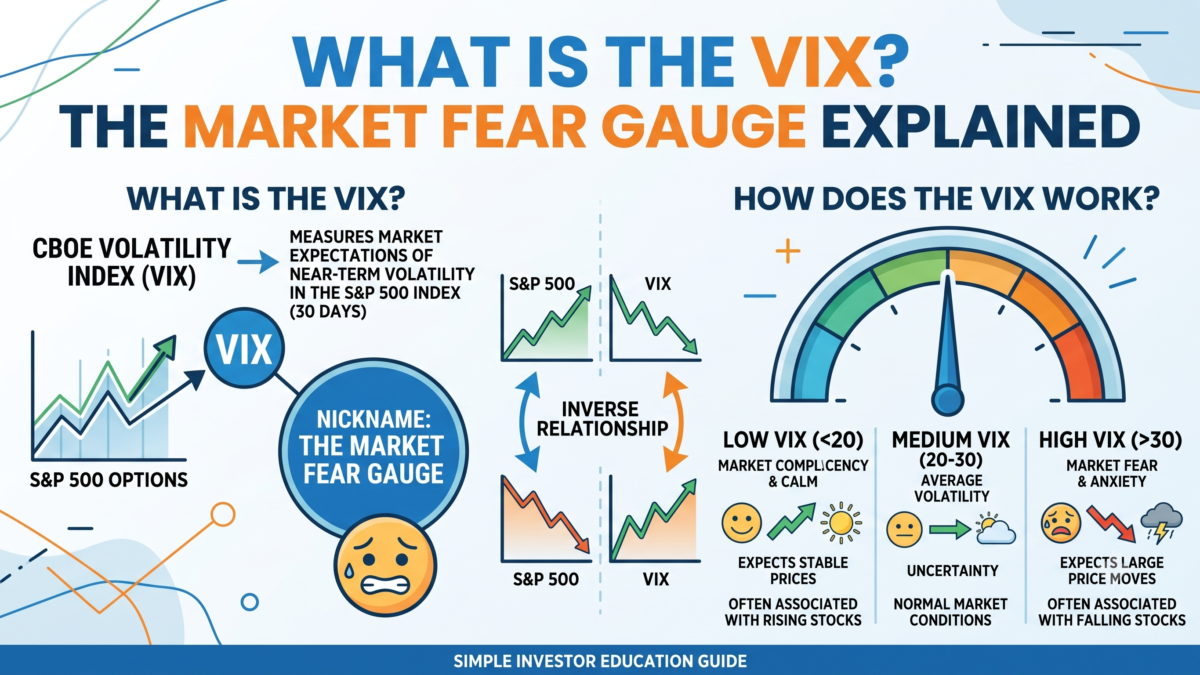
Learn how the Cboe Volatility Index measures stock market fear, how to read VIX levels, and what investors in the US and India need to know.
Key points
- The VIX measures expected 30-day stock market volatility derived from S&P 500 option prices.
- A low VIX reading (below 15) signals market calm, while a high VIX (above 30) indicates elevated fear and market stress.
- Investors cannot buy the spot VIX directly, but can access it via futures, options, and exchange-traded products.
- India operates an equivalent measure called India VIX, which tracks expected volatility for the Nifty 50 index.
If you have ever watched financial news during a stock market sell-off, you may wonder what is the vix and why traders refer to it as Wall Street’s primary fear gauge. Created by the Chicago Board Options Exchange (Cboe) in 1993, the VIX is a real-time market index representing the market’s expectation of 30-day forward-looking volatility. Rather than measuring actual market movement that has already occurred, it reflects how much price fluctuation traders expect in the immediate future.
Understanding how this index functions is essential for managing investment risk. Whether you are holding a long-term stock portfolio, trading options, or monitoring global financial stability, tracking volatility trends gives you crucial context about market sentiment and potential downside risks.
Understanding What Is the VIX and How It Works
To fully grasp what is the vix, it helps to examine how the index is calculated. The VIX does not track stock prices directly, nor is it based on historical market swings. Instead, it aggregates the weighted prices of S&P 500 index (SPX) put and call options across a wide range of strike prices. Options are financial contracts that give buyers the right to purchase or sell an asset at a predetermined price within a specific timeframe.
When institutional investors anticipate market turbulence, they rush to buy protective put options to shield their portfolios. Increased demand drives up option premiums. Because option prices reflect implied volatility—the market’s consensus view of future price swings—rising option prices cause the VIX calculation to rise. Conversely, when market participants feel confident and option demand remains quiet, option prices drop, causing the VIX to decline.
How to Interpret VIX Levels: What Is the VIX Signal Telling You?
The VIX is expressed as an annualized percentage point number, representing the expected annualized change in the S&P 500 over the next 30 days. However, most market participants simply look at the absolute numerical value to gauge investor sentiment. Here is how standard market environments generally break down:
- Below 15 (Low Volatility): Signals strong market confidence or potential complacency. Asset prices tend to climb steadily, though extended low periods can precede sudden shifts.
- 15 to 20 (Moderate Volatility): Represents typical, healthy market conditions. Prices move normally without signs of widespread stress or euphoria.
- 20 to 30 (Elevated Volatility): Indicates growing uncertainty. Market swings become larger, and investors begin paying closer attention to macroeconomic headlines.
- Above 30 (High Volatility / Extreme Fear): Signals severe market disruption, sudden sell-offs, or global financial shocks. Major historical panics have pushed the VIX past 40 or even higher.
Why the VIX Spikes When Stock Prices Fall
A common observation among market watchers is that the VIX moves inversely to major stock market indices. When the S&P 500 drops sharply, the VIX almost always spikes. When stock markets rally, the VIX usually drifts lower or stays suppressed. This asymmetric behavior is the main reason financial media labels the VIX the market’s fear index.
The reason for this asymmetry lies in human behavior and institutional risk management. Investors generally fear rapid losses far more than they fear missing out on gradual gains. When markets begin to decline rapidly, panic triggers a sudden surge in demand for downside protection through option contracts. This rapid bid for puts causes implied volatility to surge dramatically. During bull markets, stock accumulation is typically slow and steady, resulting in stable, subdued option pricing.
How Investors Can Trade or Hedge Using the VIX
Because the VIX is a mathematical calculation based on option prices, you cannot buy shares of the spot index directly in the way you buy standard company shares. However, financial markets provide several instruments for those wishing to speculate on volatility or hedge their equity holdings:
- VIX Futures and Options: Standardized derivative contracts listed on the Cboe Futures Exchange that allow institutional traders to hedge against short-term market turbulence.
- Exchange-Traded Products (ETPs): Exchange-traded notes (ETNs) and funds (ETFs) track VIX futures indices. These products allow retail brokerage accounts to gain direct long or short exposure to short-term volatility.
- Portfolio Hedging: Long-term equity investors monitor the index to evaluate market entry points, as major spikes in volatility have historically coincided with market bottoms.
It is important to note that trading VIX futures or exchange-traded products carries distinct risks. Due to market structure characteristics such as contango—where future contract prices exceed current spot levels—holding long volatility ETPs over extended periods can lead to substantial performance decay.
US vs India: Comparing Cboe VIX and India VIX
While understanding what is the vix in the US context focuses on the Cboe VIX and S&P 500 options, investors in global markets encounter similar volatility benchmarks designed for domestic exchanges. In India, the National Stock Exchange (NSE) calculates the India VIX using the order book of Nifty 50 option contracts.
Both indices operate on similar mathematical principles: they measure expected 30-day volatility expressed as an annualized percentage. In the US, market operations fall under the regulatory oversight of the Securities and Exchange Commission (SEC) and the Commodity Futures Trading Commission (CFTC). In India, volatility instruments and options trading fall under the Securities and Exchange Board of India (SEBI). For cross-border investors, observing both indices provides valuable insight into localized market risk versus global systemic stress.
Key Takeaways for Managing Risk
Tracking market volatility is one of the most effective ways to remove emotion from your financial strategy. Here are key guidelines to keep in mind:
- The VIX measures expected market swings over the next 30 days based on S&P 500 option pricing.
- High readings signal market stress and option buying, while low readings indicate market calm.
- Extreme volatility spikes often create buying opportunities for patient, long-term investors, as peak panic frequently marks market lows.
- Never hold short-term volatility exchange-traded notes indefinitely without a clear risk management plan due to potential structural decay.
Frequently asked questions
What is the vix average level historically? Historically, the VIX has averaged around 18 to 20 over long market cycles. Readings below 15 indicate lower-than-normal volatility, while readings above 25 reflect heightened market concern.
Does a high VIX mean you should sell stocks? Not necessarily. A high reading indicates that fear is already priced into options markets and stock prices have likely experienced a sell-off. For long-term investors, extreme market panic often presents valuable buying opportunities rather than a signal to sell.
How is India VIX different from the Cboe VIX? The underlying mechanics are identical, but the underlying assets differ. The Cboe VIX measures volatility for the US S&P 500 index, whereas India VIX measures expected volatility for the Indian Nifty 50 index based on options listed on the NSE.
This article is for general education and is not investment, tax or financial advice. Rules and figures change — check the official source or a licensed adviser before acting.
Official information: https://www.investor.gov
This explainer is published by the MoneyPuran desk for general awareness. Rules, limits and rates change over time — please confirm with the official source. Corrections: corrections@moneypuran.com